Showing posts with label biodiversity. Show all posts

Monday, November 3, 2025

November 2025 Science Summary

Post-dog art

Aloha,


As we head into the season of sweets in the United States (from Halloween to New Year's Eve), I wanted to include a fascinating article (Gopaulchan et al. 2025) on how scientists recently learned a trick to get fancier-tasting chocolate by using the right mix of bacteria and fungi! It's a jam-packed wild read. I've also got two articles on the Pantanal. 

If you know someone who wants to sign up to receive these summaries, they can do so at http://subscribe.sciencejon.com (no need to email me).

FIGURING OUT WHAT MAKES CHOCOLATE TASTIER
Gopaulchan et al. 2025 advances the frontier of scientific understanding of flavor development in chocolate. It has a few components. First they measured changes in temperature and pH over a week in fermenting Colombian cacao beans to estimate microbial activity (they correlated with the color changes used to assess fermentation end point). Second they sequenced the genome every 24 hours to watch diversity decline for both bacteria (Fig 1e, Acetobacteraceae dominating over time) and fungi (Fig 1f, Saccharomycetaceae dominating over time). But crucially, they third compared how these shifts happened at three farms w/ similar genetics but different microbial mixes. Look at Fig 2e and 2f!!! The two new farms had diversity increase again eventually, and one farm had significant populations of families that were only present in trace amounts before! OK, stay with me. Fourth, they extracted cocoa liquor and compared their three farms to reference choocolates (Fig 3b). One farm tastes "West African" (roasty, dark wood, tobacco), and two taste more "Malagasy" (one emphasizing light / caramelly / tropical flavors, and the other more fruity and bitter). Fifth they figured out which familiies of microbes were likely most essential for flavor (Fig 4) and sixth put together different incoculant mixes (most had the full diversity of microbes minus a different single strain missing for each mix, plus a random mix). They then (seventh) did controlled cacao bean fermentation w/ each mix plus an uninoculated control (in the lab so it wouldn't have the wild strains), and tasted the results (eighth), finding that the beans inoculated with the full mix of strains had better flavors than those inoculated w/ fewer strains or none at all (Fig 5h). The authors argue that with synthetic starters and controlled fermentation, chocolate flavor could be improved in more industrial-scale chocolate.


PANTANAL:

Fernando et al. 2025 looks at variation in fish biodiversity across the Upper Paraguay River Basin (the Pantanal and its headwaters, see Fig 1). They found the Pantanal floodplain has higher fish species richness than the headwaters, BUT note that the headwaters have: more undescribed species (at least 60), clear threats to the hydrology, likely more endemic species, and headwater threats are likely to impact species in the floodplain as well. Mid-altitudes had high richness in a small area due to overlap in species from below and above. Considering all factors, the authors recommend more conservation focus on the headwaters.

Tomas et al. 2025 recommends eight principles for good conservation policy in the Pantanal: 1) manage the entire Upper Paraguay River Basin; 2&3) use a range of management options for the entire region (not only some habitats); 4) maintain environmental heterogeneity and functionality; 5) Maintain hydrological integrity and connectivity; 6) expand protected areas to represent all ecosystems; 7) incentivize conservation (e.g., via carbon or biodiversity credits, payment for ecosystem services, etc.); and 8) support Indigenous people and their way of living.


REFERENCES:
Fernando, A. M. E., Severo‐Neto, F., Ferreira, F. S., Mateus, L., Tondato‐Carvalho, K. K., Kashiwaqui, E. A. L., Gimenes Junior, H., Domingues, W. M., Pavanelli, C. S., Pinho, H. L. L., Penha, J., & Súarez, Y. R. (2025). Fish distribution across altitudinal gradients in the Upper Paraguay River Basin: Implications for conservation in the Pantanal region. Conservation Science and Practice, 7(7), 1–12. https://doi.org/10.1111/csp2.13290

Gopaulchan, D., Moore, C., Ali, N., Sukha, D., Florez González, S. L., Herrera Rocha, F. E., Yang, N., Lim, M., Dew, T. P., González Barrios, A. F., Umaharan, P., Salt, D. E., & Castrillo, G. (2025). A defined microbial community reproduces attributes of fine flavour chocolate fermentation. Nature Microbiology, 10(9), 2130–2152. https://doi.org/10.1038/s41564-025-02077-6

Tomas, W. M., Andrade, M. H., Berlinck, C. N., Bolzan, F., Camilo, A. R., Catella, A. C., Chiaravalloti, R. M., da Cunha, C. N., Damasceno Junior, G. A., Fernando, A. M. E., Garcia, L. C., Girard, P., Ikeda‐Castrillon, S. K., da Silva, C. J., Laps, R., Mateus, L., Morato, R. G., Mourão, G., Nunes, A. V., … Urbanetz, C. (2025). Eight basic principles for the elaboration of public policies and development projects for the Pantanal. Conservation Science and Practice, 7(7), 1–10. https://doi.org/10.1111/csp2.13207


Sincerely,
 
Jon
 
p.s. The paintings were both made partly by a dog; we put paint on a board, covered it with plastic wrap, and put a "pup cup" on top so as the dog ate the treat it smeared the paint and made art! Here's a pic of the painting on the right before the dog helped, and another of the dog (Jito) in action.

Tuesday, July 1, 2025

July 2025 science summary

Dramatic sunset in Wildwood

 Happy July,


In addition to the usual summaries, I have a request the non-scientists among you (or at least people doing policy or implementation and not JUST science). I have a one-question open-ended survey asking "What one piece of advice would you give scientists to be more effective? What should they do more or less of?" I'd welcome the input and will also share what I hear back in the next summary (and will split the results by advice from scientists and non-scientists if people self-identify). https://forms.cloud.microsoft/r/DXG1n76Q9V  Please reply by Friday July 25 to give me time to read and summarize everything.

The seven summaries cover conservation priorities for birds and people in the US, fire, how fire influences water quantity, and four covering various topics in the Pantanal.

If you know someone who wants to sign up to receive these summaries, they can do so at http://subscribe.sciencejon.com (no need to email me).

CONSERVATION PRIORITIES IN THE U.S. (BIRDS AND PEOPLE):
Neugarten et al. 2025 analyzes overlap of places in the US important to birds with places important for ecosystem services (ES, with climate mitigation broken out separately). They use the 37% of the US producing the most ES (as per Chaplin-Kramer et al. 2023, and from the same paper the 44% of the US storing 90% of vulnerable carbon as carbon priority areas) and bird abundance data form eBird. My TL;DR for this paper is that the natural places people need most help birds better than average, BUT they perform badly for wetland birds and generalists so we need to conserve places good for people AND places good for birds that people don't need as much. Longer take-aways 1) places good for ecosystem services are better than random places for a slight majority of bird species, 2) only 42% of species did better than random w/ carbon priority areas (mostly forest birds as you'd guess), 3) most of the 57 "tipping point" species (who lost 1/2 of their population size over 50 years and are on track to go extinct) don't do well with either ES or carbon priorities, 4) wetland birds and generalists (and to some degree aridland birds) are poorly represented by ES and carbon priorities, 5) "Regions with especially high co-benefits for birds, ES and carbon include the Appalachian Mountains, the southeastern U.S., New England, the Ozarks, and the Sierras and Cascade mountain ranges (Fig. 2a)". This news article has a good summary (although note that my quote about this research being useful to inform where and how conservationists work cut off the end of the sentence which was "along with other strategic considerations" since feasibility and other factors are key). https://news.mongabay.com/short-article/2025/05/study-identifies-us-regions-that-benefit-birds-people-climate-the-most/


FIRE:
Siquiera et al. 2025 has a helpful reminder that finer data isn't always better. They found free MODIS data (which is relatively fast and easy to process due to 500m resolution) actually did a little better at detecting areas that had burned in the Pantanal than Sentinel 2 data (also free but needs more babying and at 10m [2500* finer resolution] it takes a ton more processing time). LANDSAT (at 30m) did worse than either. The only caveat is that their validation for “burned areas” is fire foci which are partly derived from MODIS which likely biases the results somewhat. But anytime we can get away with using coarser data to save time and money it’s good news! One of my papers (https://zslpublications.onlinelibrary.wiley.com/doi/full/10.1002/rse2.61) has a table about when coarser vs. finer data may be better, and that table is in a blog here: https://rsecjournal.blog/2017/08/25/how-much-data-is-enough-investigating-how-spatial-data-resolution-impacts-conservation-decision-making/


FIRE AND WATER QUANTITY:
Guzmán-Rojo et al. 2025 is an interesting model of how fires in the Bolivian Chiquitano dry forest affect water availability, focusing on soil changes (crusting, ash deposition, and reduced porosity which can decrease infiltration and increase runoff) rather than vegetation loss. They found ~40% lower recharge in the first year after a hypothetical very severe fire, returning to ~10% lower than pre-fire after two years. However, they note that field data showed that moderate to severe fires actually reduced soil porosity by 39%, while their hypothetical very severe fire assumed a 70% reduction which is probably an upper bound for how much soil permeability could be reduced. They also note that if they had accounted for vegetation loss in their model, the recharge may have been lower in some areas where dense vegetation transpires more water than it intercepts. While they had limited data to validate their model they used other studies and proxies where they could.


BIODIVERSITY OFFSETTING / PANTANAL:
While Lourival et al. 2025 ponders 10 questions for biodiversity offsetting in the Brazilian Pantanal and its watershed (listed at the top of the 3rd page), it's relevant to biodiversity offsets in general. I especially like Fig 4 with different ways to think about equivalence for offsets (area, economic value, ecosystem value, or a mix). So for example if you clear high-value land in the Cerrado, you could need to protect a much larger lower-value area in the Pantanal. They find 57% of properties in the highlands feeding the Pantanal are out of compliance with the Forest Code (Table 1, Fig 3). Properties WITHIN the Pantanal are only 22% out of compliance, so considering the whole river basin could offer opportunities BUT ecological equivalence may be low and state regulations restrict what is possible. One could argue that's a huge market for offset purchases OR evidence the law is toothless and demand will be low.


PANTANAL:
Guerra et al. 2025 looks at how ecosystem services in the Pantanal and its highlands will change by 2050 under three scenarios (S1 - business as usual (BAU), S2 - increased expansion of ag and industry, and S3 - sustainable intensification). The sustainable scenario could cut soil runoff into rivers almost in half (Figs 4 & 5) and reduce habitat loss by a third compared to BAU (Fig 3). The authors point to some promising new policies that could help the sustainable path, including the growth of the FPS system for ranching and payments for ecosystem services (PES) at national and state (Mato Grosso do Sul) levels, altough there are no PES programs in the Pantanal yet.

Tomasella et al. 2025 found that over recent decades (the time periods are weirdly overlapping and of different length, e.g., 1981-2000 vs 1991-2020) the Pantanal has seen a 4.8% drop in precipitation, 2.9% increase in potential evapotranspiration, and the aridity index (the ratio of those two – with a lower aridity index meaning drier conditions) decreased by 7.5% (brown areas in Fig 5 at right). Fig 3 shows that a chunk of the Pantanal (11,500 km) has dried out enough to change biome from humid to “dry sub-humid.”

Fernandes et al. 2025 uses remote sensing to see how changing sediment loads affected river geomorphology (how the river channel moves over time) in the Cuiabá river in the Pantanal. Stream ecologists often focus on sediment as a pollutant coming from deforestation and agriculture, and that is an issue here (as it is in the nearby Taquari river). But in this case, the construction of the large Manso dam in 2002 has reduced sediment load more than land use change has increased it, perhaps below healthy sediment levels (see Fig 9) for 500km downstream of the dam.


REFERENCES:
Chaplin-Kramer, R., Neugarten, R. A., Sharp, R. P., Collins, P. M., Polasky, S., Hole, D., Schuster, R., Strimas-Mackey, M., Mulligan, M., Brandon, C., Diaz, S., Fluet-Chouinard, E., Gorenflo, L. J., Johnson, J. A., Kennedy, C. M., Keys, P. W., Longley-Wood, K., McIntyre, P. B., Noon, M., … Watson, R. A. (2022). Mapping the planet’s critical natural assets. Nature Ecology & Evolution, 7(1), 51–61. https://doi.org/10.1038/s41559-022-01934-5

Fernandes, B. S., de Oliveira, S. C., & Pupim, F. N. (2025). Anthropogenic disturbances drive the morphological and sedimentary changes of the Cuiabá River, Pantanal, Brazil: a remotely sensed approach. Earth Science, Systems and Society. https://doi.org/10.1144/esss2024-007

Guerra, A., Resende, F., Bergier, I., Fairbrass, A., Bernardino, C., Centurião, D. A. S., Bolzan, F., Marcel, G., Rosa, I. M. D., da Silva, J. C. S., Garcia, L. C., Larcher, L., de Oliveira, P. T. S., Chiaravalloti, R. M., Roscoe, R., Louzada, R., Santos, S., Tomas, W. M., Nunes, A. V., & de Oliveira Roque, F. (2025). Land use and regulating ecosystem services scenarios for the Brazilian Pantanal and its surroundings under different storylines of future regional development. Conservation Science and Practice, August 2024, 1–16. https://doi.org/10.1111/csp2.70012

Guzmán-Rojo, M., Silva de Freitas, L., Coritza Taquichiri, E., & Huysmans, M. (2025). Groundwater Vulnerability in the Aftermath of Wildfires at the El Sutó Spring Area: Model-Based Insights and the Proposal of a Post-Fire Vulnerability Index for Dry Tropical Forests. Fire, 8(3), 86. https://doi.org/10.3390/fire8030086

Lourival, R. F. F., de Roque, F. de O., Bolzan, F. P., Guerra, A., Nunes, A. P., Lacerda, A. C. R., Nunes, A. V., Alves, A., Filho, A. C. P., Ribeiro, D. B., Eaton, D. P., Brito, E. S., Fischer, E., Neto, F. V., Porfirio, G., Seixas, G. H. F., Pinto, J. O. P., Quintero, J. M. O., Sabino, J., … Tomas, W. M. (2025). Ten relevant questions for applying biodiversity offsetting in the Pantanal wetland. Conservation Science and Practice, July 2022, 1–21. https://doi.org/10.1111/csp2.13274

Neugarten, R. A., Davis, C. L., Duran, G., & Rodewald, A. D. (2025). Co-benefits of nature for birds, people, and climate in the United States. Ecosystem Services, 73(May), 101733. https://doi.org/10.1016/j.ecoser.2025.101733

Siqueira, R. G., Moquedace, C. M., Silva, L. V., de Oliveira, M. S., Cruz, G. D. B., Francelino, M. R., Schaefer, C. E. G. R., & Fernandes-Filho, E. I. (2025). Do finer-resolution sensors better discriminate burnt areas? A case study with MODIS, Landsat-8 and Sentinel-2 spectral indices for the Pantanal 2020 wildfire detection. International Journal of Remote Sensing, 00(00), 1–24. https://doi.org/10.1080/01431161.2025.2496000

Tomasella, J., do Amaral Cunha, A. M., Zeri, M., & Costa, L. C. O. (2025). Changes in the aridity index across Brazilian biomes. Science of The Total Environment, 989(March), 179869. https://doi.org/10.1016/j.scitotenv.2025.179869


Happy reading,
 
Jon
 
p.s. The photo above was an especially vivid winter sunset in Wildwood, NJ

Wednesday, May 1, 2024

May 2024 science summary

Blackwater River trail

Ahoy,

This month I have a mixed bag of four unrelated articles: the efficacy of conservation globally, the state of wetlands in the US, the state of the world's migratory species, and one on how biodiversity relates to productivity in forests.

If you know someone who wants to sign up to receive these summaries, they can do so at http://bit.ly/sciencejon (no need to email me).

CONSERVATION IMPACT:
Langhammer et al. 2024 is the big splashy new Science paper looking at the impact of conservation. It's a meta-analysis of trials comparing interventions to counterfactuals (similar areas w/o action). They found conservation helps 2/3 of the time (45% of trials led to absolute improvement in biodiversity, 21% reduced biodiversity loss), but is harmful 1/3 of the time (in 21% of trials biodiversity declined more due to conservation, in 12% it improved less due to conservation), and only 2% of trials showed no difference). That's not a great track record - I'd hoped net harm would be rare (1/3 is very high!), and just over half the time we're losing biodiversity despite trying to stop it. Fig 2 helpfully shows how impact varies by type of intervention: protected areas show the smallest positive effect on average, and invasive species removal shows the largest positive effect. I'd ignore "sustainable use of species" b/c it's a weirdly broad category that somehow only included 4 papers on wildlife hunting and 1 on fishing, although a few fishing papers are included under protected areas (details in the supplement - this makes me think their sample is not representative of conservation broadly). While the authors conclude conservation is working and we should do more of it, I bet if this was a paper on medical efficacy we'd consider interventions that are 2/3 helpful and 1/3 harmful an urgent cry to improve efficacy BEFORE we try to scale work that is so often ineffective or harmful. Would you send your kids to a school where 1/3 of students learned less than kids not in school at all?


WETLANDS:
The latest report on the status of wetlands in the US (excluding AK and HI) is a bummer but has some useful info. Key summaries are in Fig 9 and Table 2, but in short on net 221,000 acres of wetlands were converted, mostly to ag and tree plantations followed by housing developments. But that net change hides that fact that we actually lost 670,000 acres of vegetated wetlands, with non-vegetated wetlands like ponds, sandbars, and mudflats increasing (but NOT providing nearly as much ecological value). The report calls for more coordination to achieve no net loss of wetlands, to update and improve the National Wetlands Inventory, develop and implement better wetland conservation and management (duh), and commit to long-term monitoring and adaptive management.


MIGRATORY SPECIES:
The new State of the World's Migratory Species report (UNEP-WCMC 2024) has an update on how the 1,189 migratory species in CMS are doing. Almost half (44%) are in decline (with 22% at risk of extinction, including 97% of listed fish spp), 1/3 are stable, and the rest are split between improving and unknown. The report also notes that 399 spp not even listed in CMS (including ~200 fish spp, ~150 bird spp, and ) are at risk (from critically endangered to near threatened). See Fig 2.10b for an overview of which migratory species CMS leaves out (including horseshoe crabs!) and 2.10c for the subset at risk. Unsurprisingly the main threats are habitat loss (along w/ degradation and fragmentation) and overexploitation (hunting and fishing). Recommendations on page ix-xi are familiar and unsurprising (albeit important). There's a blog about this paper with key highlights at: https://www.unep.org/news-and-stories/press-release/landmark-un-report-worlds-migratory-species-animals-are-decline-and


BIODIVERSITY:
At first I thought Liu et al. 2024 was saying that productivity (the rate at which biomass is created) is a great predictor of forest species richness / biodiversity. That's not right though! Look at Fig 2 - they're actually saying that to predict productivity there is a significant but weak positive correlation to tree species richness, which is about the same as the correlation w/ more compelx metrics (functional attribute diversity and phylogenetic diversity). But forest stands under 30 show lower productivity with higher richness, and wildlife richness is left out entirely. So this is less of a strong & clear relationship, and more of a "if you're going to compare the two you may as well use the simpler metric" result.

REFERENCES:

Lang, M. W., Ingebritsen, J. C., & Griffin, R. K. (2024). Status and Trends of Wetlands in the Conterminous United States 2009 to 2019. U.S. Department of the Interior; Fish and Wildlife Service, Washington, D.C. 43 pp. https://www.fws.gov/project/2019-wetlands-status-and-trends-report

Langhammer, P. F., Bull, J. W., Bicknell, J. E., Oakley, J. L., Brown, M. H., Bruford, M. W., Butchart, S. H. M., Carr, J. A., Church, D., Cooney, R., Cutajar, S., Foden, W., Foster, M. N., Gascon, C., Geldmann, J., Genovesi, P., Hoffmann, M., Howard-McCombe, J., Lewis, T., … Brooks, T. M. (2024). The positive impact of conservation action. Science, 384(6694), 453–458. https://doi.org/10.1126/science.adj6598

Liu, Y., Hogan, J. A., Lichstein, J. W., Guralnick, R. P., Soltis, D. E., Soltis, P. S., & Scheiner, S. M. (2024). Biodiversity and productivity in eastern US forests. Proceedings of the National Academy of Sciences, 121(14), 2017. https://doi.org/10.1073/pnas.2314231121

UNEP-WCMC, 2024. State of the World’s Migratory Species. UNEP-WCMC, Cambridge, United Kingdom.
https://www.cms.int/en/publication/state-worlds-migratory-species-report

Sincerely,
 
Jon

 
p.s. This photo is on the Blackwater River Trail in the Canaan Valley Resort State Park, where we were treated to some April snow on vacation!

Monday, April 3, 2023

April 2023 science summary

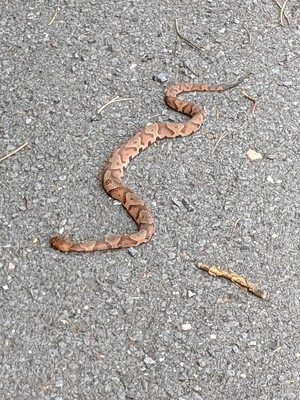
Snake

Hello,

In case you missed it last month, check out the paper I co-authored on gender equity (I repeated the summary below, read or skim the whole paper if you have time, or at least read this blog overview).

The IPCC's latest synthesis report came out recently (and I have a short summary below), so the need to do more on climate change is on my mind.

Want to work on climate change via energy modernization at Pew? We're hiring for three jobs right now on a team that I'm super excited about. If you have any questions and/or may be interested please take a look at the posts and then let me know if you want to know more (and please pass them on):

  1. Senior Officer, Clean Grid and Energy

    https://pewtrusts.wd5.myworkdayjobs.com/TrustsExternal/job/Washington-DC-901-E/Senior-Officer--Clean-Grid---Energy_R002036

  2. Officer, State Campaigns

    https://pewtrusts.wd5.myworkdayjobs.com/TrustsExternal/job/Washington-DC-901-E/Officer--State-Decarbonization-Campaign-Lead_R002067

  3. Senior Associate, State Campaigns

    https://pewtrusts.wd5.myworkdayjobs.com/TrustsExternal/job/Washington-DC-901-E/Senior-Associate--State-Decarbonization-Campaigner_R002086


Also - recently I am playing less w/ AI and reading more science myself, but thought this was a nice overview of strengths and weaknesses between ChatGPT, Bing, and Bard.


If you know someone who wants to sign up to receive these summaries, they can do so at http://bit.ly/sciencejon (no need to email me).

CLIMATE CHANGE (IPCC report):

The IPCC's latest report (the AR6 synthesis) recently became available (here’s a direct link to the 36 page summary for policy makers). If you've been following all the IPCC reports, there is no new info here. But there is a persistent thread of clarity that I found helpful. Of the many findings, the ones that stood out to me are:

  1. The planet has warmed 1.1 degrees C already (1.6C on land)

  2. The world is currently roughly on track for 3.2 C of warming based on implemented policies (Fig SPM5a, w/ range from 2.2C to 3.5C).

  3. Good news - that means that "business as usual" is a little worse than RCP4.5 (Intermediate Emissions), ranging from Working Group III scenarios C5 to C7 (C7=High GHG emissions or SSP3-7.0). The high emissions (RCP8.5) scenario is pretty unlikely since it would require emissions to go up substantially over what is predicted. See Table 1 in Box SPM.1 for details.

  4. Bad news - look more closely at Fig SPM5a. The paths to limit warming to 2C or 1.5C assume sharp cuts starting in 2020, which means even if we act immediately, cuts would have to be much sharper to make those pathways feasible (the report notes the lack of both commitments and financing). We should still make the attempt, but remember there is no magic binary threshold, and every bit of warming we avoid has real value.

  5. They project climate impacts on species loss, human health, and food production (see Figure SPM3).

I was struck by two quotes in particular:

“Adaptation options that are feasible and effective today [JF reminder - elsewhere they note: "‘today’ refers to 2019"] will become constrained and less effective with increasing global warming.”

“All global modelled pathways that limit warming to 1.5°C (>50%) with no or limited overshoot, and those that limit warming to 2°C (>67%), involve rapid and deep and, in most cases, immediate greenhouse gas emissions reductions in all sectors this decade.” (again, immediate relative to 2019).

The press release also notes that "Emissions should be decreasing by now [JF - again, that's 2019] and will need to be cut by almost half by 2030, if warming is to be limited to 1.5°C." This blog post highlights existing progress and what we need to do next.

AI side note: I asked Google Bard (their new beta AI) "What does the latest IPCC synthesis report say is the most likely amount of warming the world will experience?" and got a wrong answer: "The latest IPCC synthesis report says that the most likely amount of warming the world will experience is 1.5 degrees Celsius above pre-industrial levels.” (along with other text). But when I asked Bard "How much has the earth warmed so far, according to the latest IPCC synthesis report" it correctly states: "According to the latest IPCC synthesis report, the Earth has warmed by 1.1 degrees Celsius (2 degrees Fahrenheit) since the start of the industrial era."

CLIMATE CHANGE (other):

Pearson et al. 2023 investigate whether restoring whale populations is likely to have a significant impact on climate mitigation. The idea being evaluated is that beyond carbon stored in whales themselves (which ends up in the deep sea when they die), that their poop stimulates a lot of phytoplankton growth which leads to net carbon capture (see Fig 1). The TL;DR results: whales and their poop MAY provide climate mitigation benefits but: we don't know yet, it'll take a long time to know, and additionality may be low (so don't sell whale carbon credits, please). See Box 1 for concerns w/ whale carbon credits, and box 2 for outstanding questions to be answered. They do note that whale recovery can be a "low regret" strategy, and I'd agree as long as it doesn't delay emissions reductions or otherwise pull resources from more proven climate solutions.

BIODIVERSITY:

NatureServe's 2023 Biodiversity in Focus US report is a high level look at threatened species (imperiled or vulnerable) in the US. It's short and worth reading the whole thing. They find 34% of plant species and 40% of animal species are threatened, and 41% of the ~400 ecosystem groups in the US are at risk of "range-wide collapse" (meaning being replaced or substantially transformed). Figure 1 and 2 have breakdowns of averages for plants and animals by subgroups. For plants cacti are the worst off at 48% threatened and sedges are the least threatened at 14%. Freshwater snails are the most threatened animals (75%, and other FW groups are all more threatened than average) while birds are the least threatened (12%) and bees are about average (37%). Note that % of species that are threatened is different than looking at % of individual organisms or biomass that is threatened (all are useful metrics, Audubon's State of the Birds report looks at trends in bird population size). Figure 3 shows the most and least threatened ecosystems; unsurprisingly virtually all tropical ecosystems are threatened (they had relatively small extents originally, and are valuable for agriculture), while cliffs / rock and alpine and tundra ecosystems fare the best due to less threat of conversion to other land uses and higher rates of protection (Figure 5). They don't provide details but I would guess these are relatively short-term predictions, as climate change will threaten a lot of alpine and tundra ecosystems in the long term. Figure 4 shows how protected different species groups and ecosystems are. Almost 30% of vascular plant species are protected >50% of their range, but only 15% of vertebrate species are that protected. Finally, Figure 9b shows which states have the highest % of their area in at-risk ecosyetsms (NE, MT, and SD score the highest due to large at-risk grasslands), and Figure 11 shows priority areas for conserving imperiled species. With some exceptions (like FL) Figures 9 and 11 highlight different priority areas; Fig 11 focuses on relatively small and irreplaceable places that the most threatened species rely on, while Fig 9 focuses on more intact and lower diversity ecosystems that are at risk of being transformed (but with less potential for species extinctions). The authors conclude that the Restoring America's Wildlife Act (RAWA) guided by State Wildlife Action Plans (SWAPs) is our best bet to catalyze massive investment in conservation of the places that need it most.

WILDLIFE MANAGEMENT:

Jewell et al. 2023 surveyed directors and board members in charge of state wildlife agencies in the SE U.S. about future conservation challenges and how they plan to respond. They found that the respondents were focused on funding and 'agency relevance' (including changing values and fewer hunters) but less concerned about climate change (see Table 2). One quote stuck out at me, which was that they saw climate change impacts as important at time-scales beyond decades, and thus not urgent to act on (they also saw it as too political). By comparison, they saw education and outreach as critical to recruit hunters and tell the public the value of hunting and fishing. Agency directors average 5 years in office, so short-term things they can do may be more appealing. The authors call for engaging decision makers around the science of how climate change is already affecting wildlife, how that is expected to shift over time, and what actions or preparations can be taken now to help.

WILDLIFE VEHICLE COLLISIONS / ROADKILL:

Moore et al. 2023 is an interesting metanalysis of how vehicle collisions impact different wildlife populations around the world. Their 83 studies (of 150 populations of 69 species) are not representative / proportional of all wildlife. Most are of either even-toed ungulates (like elk and pigs) or carnivorans (like bear and big cats), roadkill studies inevitably concentrate on places where road mortality is significant, and a lot of the studies have really small samples. But they make a good case that it's a more important issue than is typically understood. Of the 58 studies that looked at roadkill as a % of all mortality over half found roadkill to be <15%, but 25 studies found 15-45% mortality from roadkill, 6 were 45-60%, and 3 were 60-80% (although they don't provide the data in a table, so I wonder if those 3 studies are weak / small N / outliers). They also found roadkill was the biggest source of mortality for 28% of populations studies, and it was in the top 3 for virtually all studies (again, likely a mix of it being an important threat AND a skewed study selection). Check out Figure 4A and 4B to see the biological orders hit hardest by roadkill (Tasmanian devils lost the most per year, opossums had the highest share of mortality from roads).


GENDER AND CONSERVATION (REPEAT FROM LAST MONTH):
James et al. 2023 asked over 900 science & conservation staff of The Nature Conservancy about their careers and influence, and how they perceived their gender as impacting that. We found that women had less influence, experienced many barriers to their careers (including harassment, discrimination, and fear of retaliation for speaking out), and that men overestimated gender equity. Only have 5 minutes? Skip to the recommendations on page 7 (we ask orgs to: show public leadership on equity, improve transparency and accountability, diversify teams and improve career pathways for women, be flexible, include training and mentoring as part of broader change, help women connect, address sexual discrimination and harassment, and consider intersectionality). If you have 15 minutes more, read the quotes in Table 2 (p5-8) because they're really compelling and illustrative. Or if you're with the half of men and 3/4 of women in our sample who think we have more to do on gender equity (rather than that we've already "gone overboard" or that it's not an issue as some men reported), just read the whole damn paper because there's a lot of interesting detail and nuance in the results. I learned a ton while helping out on it, and I'm excited to start advocating for the recommendations. You can read it at: https://bit.ly/TNCgenderpaper or a short blog at https://blog.nature.org/science-brief/gender-bias-holds-women-back-in-conservation-careers/


REFERENCES:

IPCC (2023). AR6 Synthesis Report. https://www.ipcc.ch/report/ar6/syr/ (accessed Mar 24, 2023).

James, R., Fisher, J. R. B., Carlos-Grotjahn, C., Boylan, M. S., Dembereldash, B., Demissie, M. Z., Diaz De Villegas, C., Gibbs, B., Konia, R., Lyons, K., Possingham, H., Robinson, C. J., Tang, T., & Butt, N. (2023). Gender bias and inequity holds women back in their conservation careers. Frontiers in Environmental Science, 10(January), 1–16. https://doi.org/10.3389/fenvs.2022.1056751 or https://bit.ly/TNCgenderpaper

Jewell, K., Peterson, M. N., Martin, M., Stevenson, K. T., Terando, A., & Teseneer, R. (2023). Conservation decision makers worry about relevancy and funding but not climate change. Wildlife Society Bulletin, November 2022, 1–14. https://doi.org/10.1002/wsb.1424

Moore, L. J. ., Petrovan, S. O., Bates, A. J., Hicks, H. L., Baker, P. J., Perkins, S. E., & Yarnell, R. W. (2023). Demographic effects of road mortality on mammalian populations: a systematic review. Biological Reviews, 3. https://doi.org/10.1111/brv.12942

NatureServe. (2023). Biodiversity in Focus: United States Edition. https://www.natureserve.org/sites/default/files/NatureServe_BiodiversityInFocusReport_medium.pdf

Pearson, H. C., Savoca, M. S., Costa, D. P., Lomas, M. W., Molina, R., Pershing, A. J., Smith, C. R., Villaseñor-Derbez, J. C., Wing, S. R., & Roman, J. (2023). Whales in the carbon cycle: can recovery remove carbon dioxide? Trends in Ecology & Evolution, 38(3), 238–249. https://doi.org/10.1016/j.tree.2022.10.012


Sincerely,

Jon

p.s. The photo is of a dead copperhead I found on a road near Luray, VA

Friday, July 1, 2022

July 2022 science summary

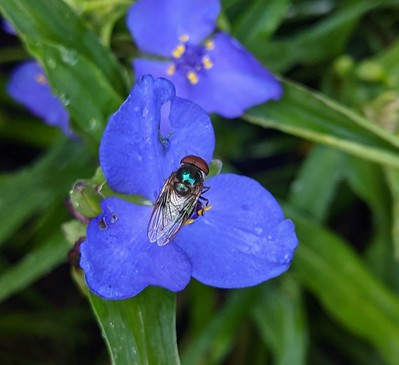
Bromeliad fly (Copestylum) on spiderwort (Tradescantia)

Hello,


This month is another grab bag: one paper on equity in fire management, two on biodiversity data, one asking how much conservation has helped species, and one pretty bad one on how ag practices impact nutrients.

If you know someone who wants to sign up to receive these summaries, they can do so at http://bit.ly/sciencejon (no need to email me).

FIRE MANAGEMENT:
Anderson et al. 2020 found that rich white communities who had a fire nearby tend to get additional prescribed fire (even when not needed). This is partly due to their ability to self-advocate at relevant planning meetings. It raises equity and social justice concerns about how we could instead base fire management on factors like social and/or ecological vulnerability. As context, here is a map showing how wildfire risk varies across the U.S.: https://www.nytimes.com/interactive/2022/05/16/climate/wildfire-risk-map-properties.html


BIODIVERSITY DATA:
Saran et al. 2022 has a good overview of biodiversity information portals, 16 global (Table 1) and 5 country-specific (from Australia, Canada, India, and the U.S., Table 2). It's a great complement to Nicholson et al. 2021 (an overview of ecosystem indicators) by providing actual data sources and some info about what each portal includes. The paper certainly isn't "comprehensive" as the title advertises, but it's a great start and I learned about some new useful resources by reading it.

Before threatened species can get protection, they need to be assessed to document how vulnerable they are. But there is a substantial backlog of species waiting to be assessed. Levin et al. 2022 offers a fairly simple (but ultimately unsuccessful) way to re-prioritize unassessed species for the IUCN red list to allow a better chance of assessing the ones that are in trouble so they can get protection. They use a rapid estimate of "extent of occurrence" (the species' range and spatial distribution of threats) as a proxy for vulnerability. At first it's exciting to see that it was 92% accurate at identifying which species were of the Least Concern (showing potential to flag species not worth assessing). But two questions are more relevant (and Fig 1 has the answers): what % of vulnerable species does it correctly recommend assessing (40%) and what % of recommendations for assessment are for species that are actually vulnerable (23%). The discussion has interesting notes on some of the aspects that confused the model (like 5 ash app threatened by Emerald Ash Borer and the American Chestnut threatened by blight) - widespread spp. hit hard by invasives are challenging to accurately assess using simple approaches like this. Hopefully the next iteration of the tool will be more successful, if they could substantially reduce false negatives for vulnerable species it could provide assessment priorities directly, or if they could substantially reduce false positives for vulnerable species it could help by indicating species that likely shouldn't be assessed.


CONSERVATION IMPACT:
Jellesmark et al. 2022 is a global (see Fig 1 map) preprint looking at how conservation has impacted targeted vertebrate species (by comparing pairs of populations targeted for conservation with those in the same country that did not receive conservation attention). I honestly don't know enough about the underlying data source (Living Planet Database) to speak to the reliability of their results (I'll wait for peer review for that, there is at least one very important typo where they use "invertebrate" when they clearly mean "vertebrate"). They found that population size of assessed vertebrates dropped 24% over 46 years, but estimate that without conservation it would have dropped 32% (and this likely underestimates the impact of conservation). They split out conservation actions into 7 groups (land/water protection, land/water mgmt, species mgmt, education/awareness, law/policy, livelihoods/incentives, and external capacity building), and capacity building followed by the first three showed the strongest results (Fig 5).


SUSTAINABLE AGRICULTURE:
Montgomery et al. 2022 asks how nutrients from ‘regenerative’ farms (that use no-till, crop  rotations, and cover crops) differ from other farms, but I wouldn't recommend it. This paper is pretty weak methodologically, results were inappropriately highlighted and over-interpreted, and the results I initially planned to write about didn’t hold up when I looked at raw data. Some key caveats: it is a very small sample size, 4/5 authors have financial interests the paper furthers, only one author appears to be a scientist (a geomorphologist), and the methods are thin and read like they may have gone looking for pairs of farms that would support the desired narrative (plus they used a very rough method to measure organic matter). At first I thought the most interesting / meaningful results are for cabbage: 10 assessed nutrients were substantially higher on regenerative farms, compared to 4 that were the same, 4 that were substantially lower, and 3 not assessed. But when you dive in, that 70% difference in vitamin E is from 0.004 to 0.007 mg/100g (essentially nil). Ditto with wheat results, 50% more calcium than “almost none” is still almost none. The animal results are hard to interpret because they don’t provide enough detail on differences between ‘regenerative’ vs. ‘conventional’ (although findings that grass-finished beef have more nutrient content have been reported in other lit, in alignment w/ results here). Some results look more meaningful (20% more vitamin C in cabbage is worthwhile) but there is such variation in the soil organic matter and soil health across the farms it’s really hard to know what is significant and what is accidental. One last note - 'regenerative' here almost certainly means 'genetically modified’ for most crops, since it’s hard to do no-till without them.


REFERENCES:

Anderson, S., Plantinga, A., & Wibbenmeyer, M. (2020). Inequality in Agency Responsiveness: Evidence from Salient Wildfire Events (Issue December). https://www.rff.org/publications/working-papers/inequality-agency-responsiveness-evidence-salient-wildfire-events/

Jellesmark, S., Blackburn, T. M., Dove, S., Geldmann, J., Visconti, P., Gregory, R. D., McRae, L., & Hoffmann, M. (2022). Assessing the global impact of targeted conservation actions on species abundance. BioRxiv, 2022.01.14.476374. https://doi.org/10.1101/2022.01.14.476374

Levin, M. O., Meek, J. B., Boom, B., Kross, S. M., & Eskew, E. A. (2022). Using publicly available data to conduct rapid assessments of extinction risk. Conservation Science and Practice, November 2020, 1–9. https://doi.org/10.1111/csp2.12628

Montgomery, D. R., Biklé, A., Archuleta, R., Brown, P., & Jordan, J. (2022). Soil health and nutrient density: preliminary comparison of regenerative and conventional farming. PeerJ, 10, e12848. https://doi.org/10.7717/peerj.12848

Saran, S., Chaudhary, S. K., Singh, P., Tiwari, A., & Kumar, V. (2022). A comprehensive review on biodiversity information portals. Biodiversity and Conservation, 0123456789. https://doi.org/10.1007/s10531-022-02420-x

Sincerely,
 
Jon
 
p.s. This photo is of what I think is a bromeliad fly (Copestylum) on a Tradescantia flower in my garden. First time I have seen one!

Monday, May 2, 2022

May 2022 science summary

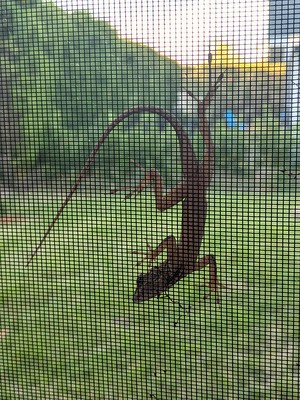
Lizard on a porch screen

Greetings,


This month I have a few science articles on freshwater, two on climate change and forest management, and one big one on biodiversity.

If you know someone who wants to sign up to receive these summaries, they can do so at http://bit.ly/sciencejon (no need to email me).

BIODIVERSITY:
Hamilton et al. 2022 is the latest analysis from NatureServe on biodiversity in the U.S., and potential priorities for new protection. They looked at habitat for 2,216 imperiled species (G1 or G2 globally, or Threatened or Endangered nationally) across the U.S., including often overlooked species like plants and bugs. There are several interesting methodological advances here (relatively fine 1-km pixels, inclusion of overlooked species, using both range maps and habitat suitability models and showing how that changes results in Fig 4, etc.), but I think most readers will want to focus on implications for new protections and management of existing protected areas. Fig 2 shows the most important areas to protect. They use protection-weighted range-size rarity, which is a kind of rarity-weighted richness focusing on places with a) relatively high # of species that b) have relatively little habitat left nationally. Table 2 has a nice summary of how many species have the majority of their habitat managed by different groups (federal agencies, state & local, private), showing there is a lot of potential for management on existing public lands (since 43% of imperiled species have most of their habitat on public lands). It's worth reading the whole thing, but if short on time I recommend the NY Times article about this and especially the interactive maps of their data.


CLIMATE CHANGE / FOREST MANAGEMENT:
Littlefield and D'Amato 2022 looks at trade-offs between maximizing forest carbon and maximizing biodiversity and habitat quality. In particular, they note that many species require disturbance (like fire or tree removal), while maximizing carbon generally involves promoting uniformly dense and mature trees. They note that robust data looking at how different species respond to forest management are surprisingly scarce, but offer several case studies where as tree biomass increased, wildlife abundance and/or diversity has declined. They recommend that conservation planning consider climate adaptation, which means keeping landscape diversity, complexity, and connectivity (accepting that means some reduction in potential carbon), and that we explicitly discuss and recognize trade-offs where they exist.

Stephenson et al. 2014 is a global analysis of how carbon sequestration by 403 tree species change as they grow and age. 87% of tree species sequester more annual carbon per year as they get bigger (even when they get huge). On average a 1m diameter tree sequesters about triple the carbon as a 1/2m diameter tree (similar to the trunk cross-section ration of 4:1). The biggest trees can add ~0.55-0.72 t biomass (not C, which would be much lower) per year (Fig 3). However, they note that at the forest level, as an even-aged stand gets older the annual carbon sequestered per land area goes down (as trees die, total sequestration declines despite remaining big trees sequestering more. Ideally forest management should think about 1) impacts on carbon pools (how much harvested tree biomass will be lost to the atmosphere), 2) impacts on carbon sequestration, and 3) impacts on forest ecology (both mature / older trees, and disturbances and younger trees have important roles).


FRESHWATER:
Broadley et al. 2022 is a global assessment (although w/ ~1/4 of studies coming from the US) of how marine fishery productivity (including invertebrates) depends on rivers. Their headline finding is that 72% of 276 fished species (77% of global catch by mass) are linked to river flows at some point in their life cycle, and 83% eat food linked to river flows. The biggest link is occasionally going to estuaries to eat (77% of species) as opposed to diadromous or estuarine-dependent species (23% of species), see Fig 5 for a map of where they're distributed. They also offer a conceptual review of how rivers influence fisheries by focusing on science literature for the top 10 fishery species by catch mass. They conclude that rivers influence fisheries via physical changes (flow quantity, timing, and quality [sediment, nutrients, salinity, temperature, etc.]), biological response of marine species to those physical changes (e.g. nutrients from a river increasing algae which zooplankton and fish respond to, changes in spawning in response to freshwater mixing, migration, etc.), and changes in fisher behavior and fishery productivity resulting from those biological changes (see Table 1). They recommend an integrated planning approach to rivers (including dam management) and marine fisheries.

Pennock et al. 2022 makes a case that rivers with relatively natural flow regimes should be priorities for conservation (specifically protection that limits consumptive water use or otherwise alters flow). They look at four tributaties of the Green River (which feeds the Colorado River): the White, Price, San Rafael, and Duchesne Rivers. Only the White River has a relatively natural flow regime (although median spring discharge is still down 25% relative to before 1949, and summer baseflow by 29%), and spring flow in the Duchesne and San Rafel are down ~80%. That drop in flow accompanies habitat degraded in several ways: less large woody debris, narrower channels, less regeneration of cottonwoods, loss of native fish spp, etc. They also point out that even dams managed for environmental flow has fallen well short of natural flood regimes.

Maasri et al. 2022 is a new global freshwater research agenda. They have 15 recommendations in 5 themes: 1) Data infrastructure (compile and integrate data sources on freshwater biodiversity, mobilize and share existing data w/ stakeholders, and develop accessible databases), 2) Monitoring (coordinate existing FW biodiversity monitoring and move towards global consistency, expand monitoring to places and species currently overlooked [like fungi and protists], and develop new monitoring methods [like eDNA, remote sensing, citizen science, etc.]), 3) Ecology (better understand how biodiversity relates to ecosystem health and services, study how biodiversity responds to multiple stressors, and study species and ecosystem responses to global change), 4) Management (rigorous assess how well restoration works, develop management strategies aligned with "Nature Futures" scenarios based on positive human-nature relationships, and develop watershed-based integrated management and restoration programs including dam building and operation), and 5 Social ecology (co-produce solutions to conflicts between conservation and people who use freshwater systems, develop adaptive management strategies that address trade-offs with a broad coalition of participants, and promote citizen science and participatory research). I was surprised that they left off legal research into how policy mechanisms for water management are working (or not), and am somewhat skeptical that agendas like this get used, but it's a nice overview of some needs and gaps.


REFERENCES:

Broadley, A., Stewart-Koster, B., Burford, M. A., & Brown, C. J. (2022). A global review of the critical link between river flows and productivity in marine fisheries. Reviews in Fish Biology and Fisheries, 0123456789. https://doi.org/10.1007/s11160-022-09711-0

Hamilton, H., Smyth, R. L., Young, B. E., Howard, T. G., Tracey, C., Breyer, S., Cameron, D. R., Chazal, A., Conley, A. K., Frye, C., & Schloss, C. (2022). Increasing taxonomic diversity and spatial resolution clarifies opportunities for protecting US imperiled species. Ecological Applications, 32(3), 1–19. https://doi.org/10.1002/eap.2534

Littlefield, C. E., & D’Amato, A. W. (2022). Identifying trade‐offs and opportunities for forest carbon and wildlife using a climate change adaptation lens. Conservation Science and Practice, 4(4), 1–14. https://doi.org/10.1111/csp2.12631

Maasri, A., Jähnig, S. C., Adamescu, M. C., Adrian, R., Baigun, C., Baird, D. J., Batista‐Morales, A., Bonada, N., Brown, L. E., Cai, Q., Campos‐Silva, J. V., Clausnitzer, V., Contreras‐MacBeath, T., Cooke, S. J., Datry, T., Delacámara, G., De Meester, L., Dijkstra, K. B., Do, V. T., … Worischka, S. (2022). A global agenda for advancing freshwater biodiversity research. Ecology Letters, 25(2), 255–263. https://doi.org/10.1111/ele.13931

Pennock, C. A., Budy, P., Macfarlane, W. W., Breen, M. J., Jimenez, J., & Schmidt, J. C. (2022). Native Fish Need A Natural Flow Regime. Fisheries, 47(3), 118–123. https://doi.org/10.1002/fsh.10703

Stephenson, N. L., Das, A. J., Condit, R., Russo, S. E., Baker, P. J., Beckman, N. G., Coomes, D. A., Lines, E. R., Morris, W. K., Rüger, N., Álvarez, E., Blundo, C., Bunyavejchewin, S., Chuyong, G., Davies, S. J., Duque, Á., Ewango, C. N., Flores, O., Franklin, J. F., … Zavala, M. A. (2014). Rate of tree carbon accumulation increases continuously with tree size. Nature, 507(7490), 90–93. https://doi.org/10.1038/nature12914


Sincerely,
 
Jon

Monday, August 2, 2021

August 2021 science summary

Hi,

This month is a grab bag of a few articles on different topics I've been meaning to read. Sorry for the lack of a theme!

If you know someone who wants to sign up to receive these summaries, they can do so at http://bit.ly/sciencejon


BIODIVERSITY / ECOLOGY:
Maron et al. 2021 offers seven guidelines to set robust biodiversity goals (aimed at the Global Biodiversity Framework [GBF] under CBD), summarized in a nice diagram in Fig 1. 1. recognize limits to "net outcome" approaches (determine which spp and ecosystems are irreplaceable), 2. use net outcomes where needed since some losses are unavoidable, 3. specify a timeline for net outcome goals (a reference year and a target year), 4. set goals for net gains (since a reference year like 2020 has some spp. and ecosystems which have experienced high historic loss, so net gaines are needed to persist), 5. capture key biodiversity (with distinct goals for ecosystems, spp., and genetic diversity), 6. avoid unintended substitutions by ensuring any losses to one species (or ecosystem) is balanced with gains to a different one only if the losses are to a relatively unthreatened component, and 7. set ambitious goals (achievable, but more than adequate). They note several changed needed to the post-2020 GBF to meet these criteria.

Lutz et al. 2018 asks how important the biggest trees in forests are across the world. My favorite figure is that the biggest 1% in diameter made up ~50% of the aboveground biomass (of trees bigger than 1 cm), although with lots of variation by forest. If you use a consistent threshold of trees >2' in diameter instead of the top 1%, they're ~40% of biomass on average. Forests where the biggest trees took up a bigger % of total biomass tended to have fewer species in that top size class. They point out that for carbon sequestration, these big trees are super important, which Bill Moomaw has also emphasized in advocating for 'proforestation' where we just leave forests alone for longer before logging them as the rate of sequestration goes up as they get really big.

Hall et al. 2021 is about Circuitscape (software to analyze wildlife connectivity at the landscape scale) and the advantages of having ported it over to Julie (a high-performance computing language). From figure 3 it looks like the new version is about 7 times as fast as the python version, and it runs as a standalone without needing to know Julia. They make the broader point that collaborating with computer scientists can reduce costs and improve efficiency, allowing more conservation to get done.


SOCIAL SCIENCE:
Dieckman et al. 2021 surveyed people about how important different social and cultural issues were to government decision makers vs. the general public. Respondents thought that government decision makers care the most about economic aspects, but that the public cares more about other social and cultural aspects. More tangible impacts (like water quality and physical safety) were perceived to be more important than intangible ones (like emotional health and local practices). Interestingly, biodiversity had the lowest perceived support second only to native culture.


REFERENCES:

Dieckmann, N. F., Gregory, R., Satterfield, T., Mayorga, M., & Slovic, P. (2021). Characterizing public perceptions of social and cultural impacts in policy decisions. Proceedings of the National Academy of Sciences, 118(24), e2020491118. https://doi.org/10.1073/pnas.2020491118

Hall, K. R., Anantharaman, R., Landau, V. A., Clark, M., Dickson, B. G., Jones, A., Platt, J., Edelman, A., & Shah, V. B. (2021). Circuitscape in Julia: Empowering Dynamic Approaches to Connectivity Assessment. Land, 10(3), 301. https://doi.org/10.3390/land10030301

Lutz, J. A., Furniss, T. J., Johnson, D. J., Davies, S. J., Allen, D., Alonso, A., Anderson-Teixeira, K. J., Andrade, A., Baltzer, J., Becker, K. M. L., Blomdahl, E. M., Bourg, N. A., Bunyavejchewin, S., Burslem, D. F. R. P., Cansler, C. A., Cao, K., Cao, M., Cárdenas, D., Chang, L.-W., … Zimmerman, J. K. (2018). Global importance of large-diameter trees. Global Ecology and Biogeography, 27(7), 849–864. https://doi.org/10.1111/geb.12747

Maron, M., Juffe-Bignoli, D., Krueger, L., Kiesecker, J., Kümpel, N. F., ten Kate, K., Milner-Gulland, E. J., Arlidge, W. N. S., Booth, H., Bull, J. W., Starkey, M., Ekstrom, J. M., Strassburg, B., Verburg, P. H., & Watson, J. E. M. (2021). Setting robust biodiversity goals. Conservation Letters, May, 1–8. https://doi.org/10.1111/conl.12816

Sincerely,
 
Jon

Tuesday, June 1, 2021

June 2021 science summary

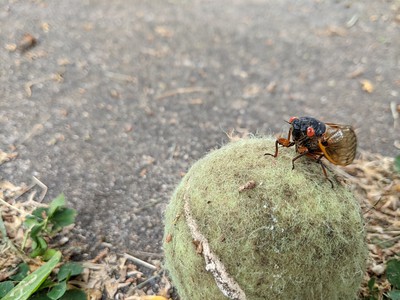
Come play with me


Hi,

Hope cicadas or other issues aren't keeping you from getting back into the world as people get vaccinated and cases are going down (in most places at least). The cicada above is super fun and ready to play!

This month I am focusing on climate change and biodiversity articles.

If you know someone who wants to sign up to receive these summaries, they can do so at http://bit.ly/sciencejon


BIODIVERSITY:

Ellis et al. 2021 argue that protecting untouched or unmodified habitat from people is a fundamentally flawed framing, b/c most habitat on earth has been to some degree inhabitated by (and modified by) people for thousands of years). It's a good point that what we consider 'natural' is subjective and arbitrary (e.g. the grasslands of the Midwestern U.S. are a result of thousands of years of intentionally set fires and other impacts by indigenous people), and modified ecosystems may have higher species richness or other metrics. They have great data on how much habitats and land use have changed over time (check out all the figures for that), and make an excellent case about how wrong it is to depict human use of nature as a recent despoiling of human-free places. They further argue that current biodiversity losses come from "the appropriation, colonization, and intensifying use of the biodiverse cultural landscapes long shaped and sustained by prior societies" and that the solution lies in empowering the stewardship of indigenous people and local communities. I agree that opinions about which kind of ecosystem and land use is "good" are subjective, that there are good social and human rights reasons to support local autonomy, and that typically local and indigenous people use natural areas in a way more compatible with biodiversity than how people from elsewhere tend to. I think it's also worth recognizing that even indigenous people have consistently caused some extinctions (of large mammals in particular) when they first arrived to actually uninhabitated ecosystems, and that in some cases they currently support the same kind of intensification associated with colonialism. So local autonomy will not always be a recipe for maintaining ecosystems more or less as they currently are, although there are plenty of valid opinions about which human and ecosystem outcomes conservation organizations should work to support. I'd definitely recommend reading the paper, and I realize I have a lot of listening and learning to do on the subject of indigenous-led conservation.

Blankenship et al. 2021 is a good overview of the best available data for historical vegetation / land cover in the U.S. (which comes from LANDFIRE's Biophysical Setting [BpS] model), and how it was produced. It estimates habitat prior to European settlement of the Americas (but not prior to the arrival of Native Americans so not free of human influence). A LOT of data and expertise went into this, including expected natural succession of diferent ecosystems after disturbance, estimated fire frequency and severity, and more. I've used it to identify which areas are appropriate to reforest and which weren't forested to begin with (so shouldn't be a target of restoration in most cases). One bonus aspect of these data is that the team who manages them are incredibly helpful and willing to provide advice and guidance on how to apply them. There is a lot of helpful detail, caveats, and next steps in here for people who may want to use these data.


CLIMATE CHANGE:

Evans et al. 2021 estimated how to reduce greenhouse gases (GHGs) by raising water levels in peatlands which have been drained for agriculture. They found raising the water table by 10cm (re-wetting the peat) reduces net greenhouse gases (GHGs) by an average of 3 t CO2e/yr until it rises to a depth 30cm, from 30cm-8cm rising methane results in smaller net GHG benefits, and <8cm GHGs become net positive (see Fig 1). Cutting the water table depth in half globally (raising it to an average of 45cm in croplands and 25cm in grasslands) would cut emissions from drained peat by about 2/3 (from 786 Mt [aka MMT] CO2e/yr to 278 MT CO2e/yr). These are conservative estimates (leaving out N2O and reduced emissions from avoided deep fires), although the range of those estimates is huge (see Table 1). Alternatively re-wetting all peat up to 10cm would eliminate almost all peat emissions and likely even drive them slightly negative (15 Mt CO2e/yr). However, cutting water table depth in half would flood part of the root zone for most crops and regions, which would reduce yield. But raising the water table to just below the root zone could have big GHG benefits and potentially even improve crop resilience to drought. This is a big opportunity!

Lenzen et al. 2018 estimate the global carbon footprint of tourism in 2013, and is a fascinating read but looks to me like it has some big errors. They find tourism is 8% of global emissions (much higher than other estimates, b/c they look at full supply chain emissions, which means this 8% cuts across several sectors). They helpfully summarize the results both by the countries where tourists reside, and the countries they visit (see Fig 1 and take a moment to read what it all means as it's fascinating). But some of their findings don't make sense to me. For example, they report that from 2009-2013 tourism spending went up by 88% while emissions only rose 15% (which seems very odd, and Fig SI2 on p21 of the supplement looks like spending only went up ~28%). Also, Fig 1 reports Canada as the top "net origin" by emissions but in Table 1 it seems like a huge net destination (with US travel to Canada by far the biggest flow globally). If anyone knows the paper and can point out if I'm missing something I'd appreciate it, otherwise this looks entertaining but unreliable.

Lipsett-Moore et al. 2018 finds that improved fire management in savannas could reduce a lot of greenhouse gas (GHG) emissions, especially in Africa (which has 77% of global potential, compared to 15% in South America and 8% in Austraila & PNG). The basic idea was piloted in Australia, and involves intentional burning in the early dry season to reduce fire (intensity, frequency, and scale) later on. The pilot roughly tripled the area burned early, while cutting the area burned late by 2/3, resulting in ~1/3 less GHG emissions over 7 years. This analysis uses remote sensing to estimate fire emissions and opportunities to reduce them. In South America the total emissions potential is much lower than Africa, but the relative change is larger (75% reduction). These changes count under Kyoto so can be used for carbon credits.

Milly and Dunne 2020 predict a roughly 9% decrease in flow in the Colorado River for every degree C increase in local temperature, due to evaporation increasing more than precipitation. Much of the paper is about different aspects of the model and how they corrected for some issues, but the core point that areas expecting more rain may still see rivers dry out was notable (especially in areas where snow cover is expected to decrease).


REFERENCES:

Blankenship, K., Swaty, R., Hall, K. R., Hagen, S., Pohl, K., Shlisky Hunt, A., Patton, J., Frid, L., & Smith, J. (2021). Vegetation dynamics models: a comprehensive set for natural resource assessment and planning in the United States. Ecosphere, 12(4). https://doi.org/10.1002/ecs2.3484

Ellis, E. C., Gauthier, N., Klein Goldewijk, K., Bliege Bird, R., Boivin, N., Díaz, S., Fuller, D. Q., Gill, J. L., Kaplan, J. O., Kingston, N., Locke, H., McMichael, C. N. H., Ranco, D., Rick, T. C., Shaw, M. R., Stephens, L., Svenning, J.-C., & Watson, J. E. M. (2021). People have shaped most of terrestrial nature for at least 12,000 years. Proceedings of the National Academy of Sciences, 118(17), e2023483118. https://doi.org/10.1073/pnas.2023483118

Evans, C. D., Peacock, M., Baird, A. J., Artz, R. R. E., Burden, A., Callaghan, N., Chapman, P. J., Cooper, H. M., Coyle, M., Craig, E., Cumming, A., Dixon, S., Gauci, V., Grayson, R. P., Helfter, C., Heppell, C. M., Holden, J., Jones, D. L., Kaduk, J., … Morrison, R. (2021). Overriding water table control on managed peatland greenhouse gas emissions. Nature. https://doi.org/10.1038/s41586-021-03523-1

Lenzen, M., Sun, Y.-Y., Faturay, F., Ting, Y.-P., Geschke, A., & Malik, A. (2018). The carbon footprint of global tourism. Nature Climate Change, 8(6), 522–528. https://doi.org/10.1038/s41558-018-0141-x

Lipsett-Moore, G. J., Wolff, N. H., & Game, E. T. (2018). Emissions mitigation opportunities for savanna countries from early dry season fire management. Nature Communications, 9(1), 2247. https://doi.org/10.1038/s41467-018-04687-7

Milly, P. C. D., & Dunne, K. A. (2020). Colorado River flow dwindles as warming-driven loss of reflective snow energizes evaporation. Science, 367(6483), 1252–1255. https://doi.org/10.1126/science.aay9187


Sincerely,


Jon

Monday, March 1, 2021

March 2021 science summary

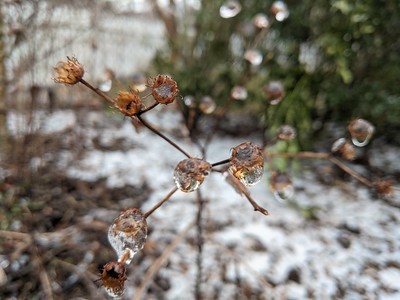
Ice balls on dead flowers

Hi,

As I write this, everything is encased in ice, so reading science with a cup of tea is pretty appealing!

I've summarized a few very useful articles on protected areas, all of which have useful insights (where to cite PAs for different goals, how they perform under climate change, and how to measure how well they protect a range of habitat types).

I've also got a paper on how flood damages have changed and how that relates to changing precipitation (and what we can expect with climate change), and one on shipping fuel regulations in China (impact on air quality, cost, and benefit:cost ratio).

If you know someone who wants to sign up to receive these summaries, they can do so at http://bit.ly/sciencejon


PROTECTED AREAS:

Jenkins et al. 2015 highlights an inconvenient truth about protected areas in the United States: they are mostly located in places with relatively low species richness and threats of conversion. In other words, if the main goal of protected areas is to prevent as many species as possible from going extent, they're poorly sited. You can compare biodiversity maps in Fig 1 & 2 to PAs in Fig 3 to see the mismatch. Fig 4 has their recommendations for 9 areas where conservation should be focused in the SE and West coast.

Jantke et al. 2019 proposes a clever way to ensure that "% protected" goals like 30 by 30 (protecting 30% of a country on land and water by 2030) don't focus on easy to protect habitat types while other habitat types remain mostly unprotected. They suggest reporting “mean target achievement” where the % protected of each habitat type would be averaged and compared to a habitat-level goal (See section 2.2 for the equation - crucially achievement maxes out at 100% so overprotection in one habitat can't compensate for underprotection in another). They use Australia's Commonwealth Marine Reserve as an example; it protects 43% of the five marine regions it covers, but still falls short of its goal of protecting at least 10% of each of the 53 bioregions within it. This is a great complement to the total % protected indicator, as ecological representation has badly lagged behind total protection, and the rush to protect a lot more area very quickly will make it very tempting to focus on the easiest habitats to protect even though many other habitats have little to no protection.

Simmons et al. 2021 (a non-peer-reviewed white paper) looks at a few options to meet 30 by 30 in the U.S. with four different focal objectives (all also minimizing acquisition cost): area alone, carbon sequestration and avoided emissions, landscape connectivity, and climate-resilient species and habitat. It’s a fairly coarse and simplistic assessment, but it does a good job highlighting the kinds of tradeoffs to consider when deciding which lands we advocate for protecting. Check out Figure 2  which shows how their four scenarios perform (on cost, ecosystem representation, and climate mitigation) and where they would protect across the lower 48 states. They close with recommending clear objectives to prioritize where to protect, focus protections on threatened areas, develop metrics to track progress and impact (including on issues like social equity), and use diverse options (beyond traditional protected areas) to provide protection. Check out the appendix for maps showing which areas are already somewhat protected (as GAP 3).

Zhu et al. 2021 analyzes forested protected areas (PAs) in the Appalachians and asks how well they will provide future habitat to birds, mammals, reptiles, and amphibians after climate change (allowing for migration). They found that climate change would worsen suitable habitat that PAs provide for mammals and amphibians, while improving habitat suitability for birds and reptiles (if they are freely able to migrate, if not all groups of species would fare worse). They also found that threatened species are more likely to have their habitat worsen (see Table 2); NatureServe's global ranks G1->G4 would see a decline in suitable habitat (although only G3 was statistically significant, and G5 significantly improved) while endangered species did significantly worse (with vulnerable and other less threatened species seeing smaller and non-significant changes). They recommend focusing protection on areas of high species richness in the Blue Ridge (and the Cumberland plateau) to a lesser extent) which will remain suitable habitat under climate change. One key caveat: the main paper assumed a high emissions scenario (RCP 8.5), with a more moderate climate scenario (RCP 4.5) modeled in Appendix S4 / Table S2.


FLOODS / CLIMATE CHANGE:

Davenport et al. 2021 analyzed historic data on precipitation and flood damages in the US. They found that as extreme precipitation (with maximum monthly precip being the most important) has increased over the past 30 years, so have flood damages. By comparing the recent past (30 yrs) to the prior 130 years, they estimate about 1/3 of recent flood damages ($73 billion) are attributable to the change in precipitation (Fig 3). They don't estimate how much of that is specifically due to anthropogenic climate change. Fig 5 has estimates of what we can expect in the future as climate change continues: the two left columns in the bottom row are the most useful. They represent the optimistic (column A) and pessimistic (column B) change in the top 1% of monthly precip. Note that even in regions expected to get dryer, the MAXIMUM rainfall will also increase (think flashier and more variable rainfall).


SHIPPING:

Zhu & Wang 2021 looks at the impact of regulations on shipping fuel in China. They found that ports w/ no penalty for non-compliance did not see improvements in air pollution, but others did. The total cost of the regulations was 4 times the price difference of the fuels, but the health benefits from the reduced pollution were >30 times as high as the cost.


REFERENCES:

Davenport, F. V., Burke, M., & Diffenbaugh, N. S. (2021). Contribution of historical precipitation change to US flood damages. Proceedings of the National Academy of Sciences, 118(4), e2017524118. https://doi.org/10.1073/pnas.2017524118

Jantke, K., Kuempel, C. D., McGowan, J., Chauvenet, A. L. M., & Possingham, H. P. (2019). “Metrics for evaluating representation target achievement in protected area networks.” Diversity and Distributions, 25(2), 170–175. https://doi.org/10.1111/ddi.12853

Jenkins, C. N., Van Houtan, K. S., Pimm, S. L., & Sexton, J. O. (2015). “US protected lands mismatch biodiversity priorities.” Proceedings of the National Academy of Sciences, 112(16), 5081–5086. https://doi.org/10.1073/pnas.1418034112

Simmons, B.A., Nolte, C., McGowan, J. (2021). Delivering on Biden’s 2030 Conservation Commitment. GDPC Working Paper 001/2021. Global Development Policy Center, Boston University.

Zhu, J., & Wang, J. (2021). “The effects of fuel content regulation at ports on regional pollution and shipping industry.” Journal of Environmental Economics and Management, 106, 102424. https://doi.org/10.1016/j.jeem.2021.102424

Zhu, G., Papeş, M., Giam, X., Cho, S., & Armsworth, P. R. (2021). “Are protected areas well-sited to support species in the future in a major climate refuge and corridor in the United States?” Biological Conservation, 255(March), 108982. https://doi.org/10.1016/j.biocon.2021.108982


Sincerely,


Jon

Tuesday, September 1, 2020

September 2020 science article summary

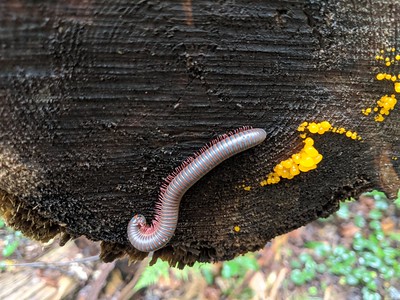
Millipede with witches butter fungus 

Greetings,

This is another short summary with just four articles on biodiversity (bugs in the US, global indicators, tropical moist forest quality, and bias in conservation textbooks in terms of which taxa etc. get featured).

If you know someone who wants to sign up to receive these summaries, they can do so at http://bit.ly/sciencejon (no need to email me).

BIODIVERSITY:
There have been a lot of papers documenting declines in invertebrate populations, from bees to flies, sometimes called the "insect apocalypse." But Crossley et al. 2020 use a large data set (from the Long-Term Ecological Research sites) to show that in much of the U.S., there's no clear trend (up or down). For abundance, some species are declining in some places, others are increasing, and overall the trend is pretty stable on net (See Fig 2 for details, including the exceptions to that pattern). Diversity is similarly flat on net (see Fig 3). The discussion (on the page w/ Fig 3) of possible explanations for why this paper had different results from others is interesting. They include: 4/5 sites this paper included that another seminal paper omitted showed positive trends, total abundance trends across spp. heavily weight the most numerous spp. and dwarf other changes, and this paper relied on more recent data (where others have found a decline is slowing).

Hansen et al. 2020 is a global analysis of moist tropical forest ecological quality and a great read. They use forests with high structural condition (meaning tall forests with several layers of understory trees and other plants, and high variation in plant size) and low human pressures as a proxy for overall ecological integrity (which typically also includes composition and function). The argument is that these forests have more habitat niches and can support more species, and that degraded structure is often due to stresses like logging which can have broad impacts (although they note limits of their approach up front). Fig 1 is a map w/ their results (& Fig 2 is a more helpful chart): they found 47% of remaining tropical moist forests had high integrity (both high structural condition and low human pressure, mapped as dark green), 33% had low structural condition (mapped as brown), and 20% had high structural condition but substantial human pressures (mapped as light green). 76% of the intact forest is in the Americas. In good news, forest w/ the best structure is being lost more slowly than more degraded forest (likely due to their remoteness, see fig 3). They have an ambitious suite of spatial recommendations in fig 4: extending protection to all remaining high integrity forests, plus restoration and working to reduce human pressure on the other forests.

Hoban et al. 2020 argue that new indicators are needed for a post-2020 CBD global framework for biodiversity. They recommend three new indicators: 1) # populations with effective population size above 500, 2) # current populations / # historic baseline of populations, 3) # species & populations w/ DNA-based genetic diversity monitoring, as well as keeping two existing CBD indicators (comprehensiveness of conservation of all species; and # of resilient, representative, and replicated plant genetic resources secured in medium or long-term conservation facilities). It's a fairly simple approach (albeit hard to empirically measure) for genetic biodiversity indicators.
 
Stahl et al. 2020 looked at 7 recent conservation textbooks and bias in what they focus on relative to natural prevalence (Fig 5 has a good summary). Some bias comes from underlying factors (research doesn't focus on species in proportion to their prevalence, more funding goes to charismatic species and richer countries), but regardless of the source they compared the proportion of examples to their prevalence on Earth. As you'd expect, the books favor examples using mammals over amphibians, North America over other continents, forests & coral reefs over other ecosystems, and tropical over temperate regions. It's an interesting topic, but there is at least one error (they claim only 3 of the textbooks mention ecoregions, but one of the other 4 discusses them at some length including an ecoregional map I created) which makes me wonder what else they could have gotten wrong (the author is looking into it and will get back to me). Ironically, the authors don't comment on potential bias in how they selected textbooks (e.g. only English language) or the methods they used (a focus on proportion of examples regardless of their value in explaining concepts). 

REFERENCES:
Crossley, M. S., Meier, A. R., Baldwin, E. M., Berry, L. L., Crenshaw, L. C., Hartman, G. L., … Moran, M. D. (2020). No net insect abundance and diversity declines across US Long Term Ecological Research sites. Nature Ecology & Evolution, (Table 1). https://doi.org/10.1038/s41559-020-1269-4

Hansen, A. J., Burns, P., Ervin, J., Goetz, S. J., Hansen, M., Venter, O., … Armenteras, D. (2020). A policy-driven framework for conserving the best of Earth’s remaining moist tropical forests. Nature Ecology & Evolution. https://doi.org/10.1038/s41559-020-1274-7

Hoban, S., Bruford, M., D’Urban Jackson, J., Lopes-Fernandes, M., Heuertz, M., Hohenlohe, P. A., … Laikre, L. (2020). Genetic diversity targets and indicators in the CBD post-2020 Global Biodiversity Framework must be improved. Biological Conservation, 248, 108654. https://doi.org/10.1016/j.biocon.2020.108654

Stahl, K., Lepczyk, C. A., & Christoffel, R. A. (2020). Evaluating conservation biology texts for bias in biodiversity representation. PLoS ONE, 15(7), 1–11. https://doi.org/10.1371/journal.pone.0234877


Sincerely,
 
Jon

Monday, August 3, 2020

August 2020 science article summary

Passion flower

Hello,

I'm on vacation in the woods with no phone or internet access, but sending this via the magic of delayed delivery. Getting away from people doesn't have as much allure these days, but getting away from the news does!

I've been looking at a lot of papers lately around big global conservation goals (which should be interesting to most), as well as more technical papers around metrics and indicators (with less broad appeal). There's also a very cool paper just out in Science on plastic pollution (and how to reduce it), and a paper from Chile finding that subsidies to plant trees had the side-effect of increasing forest cover loss (while dramatically expanding plantations).

If you know someone who wants to sign up to receive these summaries, they can do so at http://bit.ly/sciencejon

PLASTIC POLLUTION
Lau et al. 2020 is an important analysis of the scope of plastic pollution and how to reduce it. The paper found 29 Mt of plastic enters the environment each year (as of 2016, with ~1/3 going to the ocean), and plastic pollution to the ocean could triple by 2040 without immediate and sustained action. Current commitments by government and industry will only reduce the amount of plastic pollution to the ocean by 7% by 2040, but the report lays out eight measures that could reduce it by 80% by 2040 instead. There is a far better (and more thorough) summary of the paper at https://pew.org/32KPsgf


CONSERVATION GOALS
Bhola et al. 2020 sums up four different philosophies or perspectives for setting global conservation goals. 1) extending Aichi biodiversity target #11 (protecting & managing 17% of land and inland water, plus 10% coastal and marine, while considering biodiversity, equity, ecosystem services, and connectivity) to 2030 and ensuring the qualitative piece is achieved. 2) Big area-based goals like 'half earth' or protecting 30% of the earth by 2030 (still ensuring that the right places get protected). 3) ‘New conservation’ (broadening the tent for conservation via ecosystem services, ecotourism, and the private sector). 4) ‘Whole earth’ conservation which attacks root causes of habitat loss like inequality and economic growth (while arguing against separating people from nature). It's a quick read but start w/ Table 1 for a summary of the four perspectives, and Figure 1 which shows how the choice of goal (in this case, biodiversity vs. ecosystem service production) affects which areas you’d want to protect. 

Allan et al 2019 is a preprint (not peer reviewed yet) but has some weight behind it via the author list. Their approach was to start with the union of all Key Biodiversity Areas (KBAs), all wilderness areas, and all current protected areas, then see how much extra land was needed to capture enough of the range of ~29k spp. to enable their persistence. Their answer is that we need 44% of the land on earth for conservation. Note that they do NOT say 44% should be legally protected, but rather than it should be managed via a range of strategies. While there's no one single "right answer" to how much land we need (since it depends on your values, and on the assumptions and data you use), this is one of many defensible ways to approach this.

Gownaris et al. 2019 reviews 10 global analyses (from the UN and NGOs) of which parts of the ocean are the most important for conservation (see Table 1 for a list of criteria used to define importance in each). See Figure 2 for the key results; they found 49% of the ocean was both unprotected and identified as important by at least one analysis. 45% of the ocean wasn't listed as important by any analysis, 40% was important in only 1 analysis, 14% was important in 2-4 analyses (of which 88% was unprotected: not covered by an MPA of any level of protection), and <1% was important in 5 or more (of which 5% was unprotected). Virtually all important area was in blocks larger than 100 km2, and 97% of the area listed by at least two analyses was within exclusive economic zones (EEZs). They note that they couldn't get at efficacy or strength of protection, but this is a useful high level overview of some likely candidates for both new protection and improved management and/or protection in existing MPAs.


METRICS:
Fraser et al. 2006 discusses three case studies where communities were involved in choosing sustainability indicators (both environmental and human), along with external experts. Each case talks about the process they used to choose indicators, and shares example indicators. They found participatory indicator development is complex and slow (sometimes preventing use by policy makers), but empowers communities. Table 1 has some human wellbeing indicators (including some flagged as unmeasurable but representing important gaps in knowledge). Table 3 shows environmental indicators seen as providing early warning of pastoral degradation. Table 4 has a broad suite of categories of metrics (w/o detail on how to measure them) for both human and environmental issues.

Tucker et al. 2017 is an overview of metrics of phylogenetic diversity (which they break into richness, divergence / relatedness, and regularity). There is a highly technical review of 70 specific metrics, followed by a note on other key considerations like abundance, how to weight rare vs common species, and how to deal with correlations related to species richness. This could be a useful reference to someone at a project scale who really wanted to think hard about how to measure biodiversity.


LAND COVER CHANGE / CLIMATE:
Heilmayr et al. 2020 found that subsidies in Chile to increase tree cover actually led to expansion of exotic plantations (doubling in size from 1986-2011), but decreased native forests (by 13%). They estimate that biodiversity probably declined as well, while aboveground carbon only increased by 2% despite the expansion of plantations.


REFERENCES:

Allan, J. R., Possingham, H. P., Atkinson, S. C., Waldron, A., Marco, M. Di, Adams, V. M., … Watson, J. E. M. (2019). Conservation attention necessary across at least 44% of Earth’s terrestrial area to safeguard biodiversity. BioRxiv, (November), 839977. https://doi.org/10.1101/839977

Bhola, N., Klimmek, H., Kingston, N., Burgess, N. D., Soesbergen, A., Corrigan, C., … Kok, M. T. J. (2020). Perspectives on area‐based conservation and its meaning for future biodiversity policy. Conservation Biology, 00(0), cobi.13509. https://doi.org/10.1111/cobi.13509

Fraser, E. D. G., Dougill, A. J., Mabee, W. E., Reed, M., & McAlpine, P. (2006). Bottom up and top down: Analysis of participatory processes for sustainability indicator identification as a pathway to community empowerment and sustainable environmental management. Journal of Environmental Management, 78(2), 114–127. https://doi.org/10.1016/j.jenvman.2005.04.009

Gownaris, N. J., Santora, C. M., Davis, J. B., & Pikitch, E. K. (2019). Gaps in Protection of Important Ocean Areas: A Spatial Meta-Analysis of Ten Global Mapping Initiatives. Frontiers in Marine Science, 6(October 2019), 1–15. https://doi.org/10.3389/fmars.2019.00650

Heilmayr, R., Echeverría, C., & Lambin, E. F. (2020). Impacts of Chilean forest subsidies on forest cover, carbon and biodiversity. Nature Sustainability. https://doi.org/10.1038/s41893-020-0547-0

Lau, W. W. Y., Shiran, Y., Bailey, R. M., Cook, E., Stuchtey, M. R., Koskella, J., … Palardy, J. E. (2020). Evaluating scenarios toward zero plastic pollution. Science, 21(1), eaba9475. https://doi.org/10.1126/science.aba9475

Tucker, C. M., Cadotte, M. W., Carvalho, S. B., Jonathan Davies, T., Ferrier, S., Fritz, S. A., … Mazel, F. (2017). A guide to phylogenetic metrics for conservation, community ecology and macroecology. Biological Reviews, 92(2), 698–715. https://doi.org/10.1111/brv.12252


Sincerely,
 
Jon

Thursday, August 1, 2019

August 2019 science journal article summary


Photo from Mick Garratt

Greetings,

Hot weather and a vacation in the woods have me thinking about climate change and habitat conversion (with articles on deforestation, landscape conservation, biodiversity, and livestock sustainability).

If you know someone who wants to sign up to receive these summaries, they can do so at http://bit.ly/sciencejon

LANDSCAPE CONSERVATION:
Runting et al. 2019 argues that debates about 'land sparing' vs 'land sharing' miss an important point - good forest management is likely more important. They run several scenarios with different degrees of land sharing vs sparing, and conventional vs. improved management (reduced-impact logging, longer plantation rotation, and strictly enforcing protected areas). They saw the best outcomes with improved management and a mix of sparing and sharing (but favoring sparing, see Figure 4). Check out Figure 2 for what an 'optimal' scenario looks like compared to extreme sharing or sparing (but ignore the idea that tiny islands of protected areas or holes in larger ones are ideal - this is almost certainly an artifact). There's a blog on this one at https://nature4climate.org/news/headline-stories/cant-see-the-wood-for-the-trees-making-the-most-of-our-forests-for-biodiversity-and-wood-production/

Kennedy et al. 2019 calculates how modified by human activities land around the world is. While only 5% of land area was 'unmodified', most of the world was 'moderately modified.' The authors argue that ecoregions with moderate modification may be good candidates for high priority conservation action, because they tend to have some relatively intact lands near to highly modified lands (which thus may pose a threat in the near future). In particular, the tropical and subtropical dry broadleaf forests biome (mostly in Mexico, India, Argentina, & SE Asia) was found to be the most threatened (high conversion relative to protection). While they didn't include all threats (e.g. logging, invasive species, climate change, and more) these data can be used to evaluate the suitability of lands for protection. You can explore the findings and maps at http://gdra-tnc.org/current/ and you can download the data from http://s3.amazonaws.com/DevByDesign-Web/Apps/gHM/index.html


CLIMATE CHANGE:
Bastin et al. 2019 estimate 900 million ha of land could be reforested globally (excluding cropland and urban areas), which could store 205 Gt of carbon (752 Gt CO2e). Alternatively, they predict we'll lose 223 million ha of forest by 2050 under business as usual. This paper has been broadly criticized for overstating the role of reforestation in climate mitigation (while reforestation is important, the authors' conclusion that it's the most important solution is a fringe opinion), especially since they call for a focus on boreal plantings which reduces albedo relative to bare snow and ice (thus reducing the climate mitigation contribution). Here's a blog covering the paper including the critique: http://blogs.discovermagazine.com/crux/2019/07/10/reforestation-climate-change-plant-trees/#.XSdzAehJE2w

Diaz et al. 2018 looks at trade-offs between different forest management options for Douglas-fir in the NW US that could improve carbon storage. They compare managing the land to optimize net present value (NPV) to managing for sustained timber yield (with different levels of environmental management, e.g. longer rotations and some aspects of FSC certification). They find that environmental constraints boost carbon storage but hurt net present value. For example, one scenario had 26% more carbon, but 15% less timber and 21% lower NPV. They explore different policy options and challenges related to driving more carbon storage in timberlands.


DEFORESTATION:
Lambin et al. 2018 look at how effective company commitments to end deforestation are. The key finding is that public policy can significantly improve the likelihood of reducing deforestation relative to private action alone. For example, the Soy Moratorium combined sector-wide commitments with monitoring and public disincentives to clear forest in Brazil, with some success. They call for better company commitments (as called for by the Accountability Framework, https://accountability-framework.org/), and recommend public policies including: legal reform & enforcement, land tenure reform, working with people clearing the most forest, broadening scope (companies, commodities, & regions), incentivizing all actors in the supply chain to participate (e.g. fertilizer companies rarely engage in these commitments), improving traceability and transparency, and increasing demand for deforestation-free products.


LIVESTOCK SUSTAINABILITY:
Schader et al. 2015 looks at how shifting what we feed cattle could improve sustainability. The idea is to feed them less food humans could eat (like corn), and more grass and by-products we can't or don't eat (e.g. distiller's grains, bran, oilseed cake, etc.), which also limits the total amount of livestock which can be raised in this way. Figure 1 is a great overview of what this would mean, for example a big reduction in pigs and chicken and only modest increases in other livestock (that can eat grass). But note a cardinal data visualization sin: inconsistent scaling of bar charts (e.g. the soil erosion from water chart makes it look like their preferred scenario has only 42% the erosion of the reference scenario, but it actually has 88% the erosion) which means you have to look carefully. Still, it's an important concept to explore, and a useful contribution to the conversation.

What are the barriers to using livestock practices that reduce GHGs? Kipling et al. 2019 asked Welsh ranchers and other stakeholders in a series of interviews and workshops. They focused on the conceptual framework rather than the practices, splitting them into practical limitations (e.g. costs and infrastructure, see Figure 1), knowledge limitations (being unaware of options and how they work, see Figure 2), and cognitive limitations and interests (complexity and competing values, see Figures 3 & 4). There aren't any big surprises here, but it's a useful overview, especially the quotes from ranchers for each concept they present.


BIODIVERSITY:
Humphreys et al. 2019 looks at recent (since 1900) and historic plant extinction, and compares it to animal extinctions. The most interesting findings are that the IUCN Red List data on extinct plants are pretty poor (with 50 Red List species incorrectly listed as extinct, and 491 extinct species missing from the Red List), that 54% of plants reported extinct were later rediscovered (or reclassified to be the same as an extant species), that thousands of extant plant species are 'functionally extinct' (too few exist to form a viable population going forward), and that 55% of the 571 plant species that have gone extinct have done so since 1900. This is a short paper and worth reading.

REFERENCES:
Bastin, J.-F., Finegold, Y., Garcia, C., Mollicone, D., Rezende, M., Routh, D., … Crowther, T. W. (2019). The global tree restoration potential. Science, 365(6448), 76–79. https://doi.org/10.1126/science.aax0848

Diaz, D. D., Loreno, S., Ettl, G. J., & Davies, B. (2018). Tradeoffs in timber, carbon, and cash flow under alternative management systems for Douglas-Fir in the Pacific Northwest. Forests, 9(8), 1–25. https://doi.org/10.3390/f9080447

Humphreys, A. M., Govaerts, R., Ficinski, S. Z., Nic Lughadha, E., & Vorontsova, M. S. (2019). Global dataset shows geography and life form predict modern plant extinction and rediscovery. Nature Ecology & Evolution, 3(July). https://doi.org/10.1038/s41559-019-0906-2

Kennedy, C. M., Oakleaf, J. R., Theobald, D. M., Baruch-Mordo, S., & Kiesecker, J. (2019). Managing the Middle: A Shift in Conservation Priorities based on the Global Human Modification Gradient. Global Change Biology, (June 2018), 1–17. https://doi.org/10.1111/gcb.14549

Kipling, R. P., Taft, H. E., Chadwick, D. R., Styles, D., & Moorby, J. (2019). Challenges to implementing greenhouse gas mitigation measures in livestock agriculture: A conceptual framework for policymakers. Environmental Science and Policy, 92(November 2018), 107–115. https://doi.org/10.1016/j.envsci.2018.11.013

Lambin, F., Gibbs, H. K., Heilmayr, R., Carlson, K. M., Fleck, L., Garret, R., … Walker, N. (2017). The role of supply-chain initiatives in reducing deforestation. Nature Climate Change, 8(February), 109–116. https://doi.org/10.1038/s41558-017-0061-1

Runting, R. K., Ruslandi, Griscom, B. W., Struebig, M. J., Satar, M., Meijaard, E., … Venter, O. (2019). Larger gains from improved management over sparing–sharing for tropical forests. Nature Sustainability, 2(1), 53–61. https://doi.org/10.1038/s41893-018-0203-0

Schader, C., Muller, A., El-Hage Scialabba, N., Hecht, J., Isensee, A., Erb, K. H., … Niggli, U. (2015). Impacts of feeding less food-competing feedstuffs to livestock on global food system sustainability. Journal of the Royal Society Interface, 12(113). https://doi.org/10.1098/rsif.2015.0891


Sincerely,

Jon

p.s. If you'd like to keep track of what I write as well as what I read, I always link to both my informal blog posts and my formal publications (plus these summaries) at http://sciencejon.blogspot.com/