Showing posts with label protected areas. Show all posts

Monday, February 2, 2026

February 2026 science summary

A four pound turnip

Greetings,


A new paper I'm a co-author on just came out in Conservation Letters. It's about what counts as a "rapid evidence assessment" and how to do one well. Here's a 275 word blog about it: https://sciencejon.blogspot.com/2026/01/new-paper-rapid-evidence-assessments.html , the full paper (~3400 words) is here: https://conbio.onlinelibrary.wiley.com/doi/10.1111/con4.70005 , and I've summarized it below.

For any other map nerds out there; Esri has a new web map to make it easy to see 40 years of USGS land cover data at https://links.esri.com/LCExplorer . There's a blog about it at https://www.esri.com/about/newsroom/arcnews/40-years-of-usgs-land-cover-data-in-arcgis-living-atlas

If you know someone who wants to sign up to receive these summaries, they can do so at http://subscribe.sciencejon.com (no need to email me).

FRESHWATER PROTECTION:
Until very recently, we didn't have a decent estimate of which rivers were protected across the United States! Comte et al. 2026 describes how the first such database (the National Protected Rivers Assessment) was compiled and launched in Feb 2025. Since freshwater-specific protection is rare it relies mostly on assumptions about how likely different kinds of terrestrial protection are to effectively conserve the 5 key ecological attributes (KEAs) of rivers (flow, water quality, connectivity, habitat, and fish/wildlife/plants/etc. - see Fig 1). They find 19% of river length (12% of CONUS river length) has "viable" protection, although only 0.9% is comprehensively protected. Note their bar for "viable" protection (good enough) is fairly low - a score of 1.25/5 on their index. The index combines length and KEAs, so a 1.25 could mean 25% of the river provides protection for each of the 5 KEAs (overlapping or distinct), or all the river has protection for 1 KEA, and 25% has protection for another, but the other 3 KEAs are unaddressed. Hypothetically a river w/ 100% protection on 4 KEAs would score as "comprehensive" protection but could lack any protection from water withdrawals that would make the river run dry. See Fig 4 for rivers in the best shape that are most important for drinking water. This is a super useful resource. Explore the data at https://map.myriver.americanrivers.org/


CARBON AND WATER FOOTPRINT OF AI:
Xiao et al. has granular state projections of demand for AI through 2030, plus the carbon and water footprint of AI in each state. They recommend trying to steer data center growth to four states (TX, MT, NE, SD) given relatively low water scarcity and abundance of renewable energy (and potential to expand wind and solar). With the middle case assumptions by 2030 AI's water footprint would only be ~0.2% of current US crop water footprint, and the energy consumption would be ~2% of current total electric power generation. AI can have important local impacts and is growing fast, but national impacts are still projected to be relatively small.


IMPACT EVALUATION:
Neugarten et al. 2025 is a good overview to how to evaluate if conservation worked or not. They define impact evaluation and key terms like counterfactuals (what would have happened w/o conservation), confounders (variables that make understanding impact harder), and cover different types of evaluation (randomized experimental, quasi-experimental, and qualitative methods). They also discuss why looking at trends alone can be misleading (wildlife population might be dropping, but would have dropped more w/o action). They conclude recommending impact evaluation for projects that are high stakes, expensive, over big areas, untested, and/or assume additionality.


RAPID EVIDENCE ASSESSMENTS:
Webb et al. 2026 (I'm a co-author) proposes a consensus definition of what should count as a "rapid evidence assessment" (or REA) in conservation. It can be hard to find the sweet spot when assessing evidence. Too quick and dirty and you can get wrong answers, but too rigorous and the results 1) may come too late to be useful and 2) take a lot of resources that could be spent on multiple smaller studies. The paper has our final definition, recommended steps for a REA, and Table 1 has a nice little guide to picking what level of rigor may be the best fit in different circumstances.


REFERENCES:

Comte, L., Olden, J. D., Littlefield, C., Dickson, B. G., Zablocki, J., & Moryc, D. (2026). National assessment of river protection in the United States. Nature Sustainability. https://doi.org/10.1038/s41893-025-01693-8

Neugarten, R., Rodewald, A., Eklund, J., & O’Garra, T. (2025). An introduction to impact evaluation for conservation. Conservation Science and Practice, 7(11), 1–9. https://doi.org/10.1111/csp2.70169

Xiao, T., Nerini, F. F., Matthews, H. D., Tavoni, M., & You, F. (2025). Environmental impact and net-zero pathways for sustainable artificial intelligence servers in the USA. Nature Sustainability, 8(12), 1541–1553. https://doi.org/10.1038/s41893-025-01681-y

Webb, J. A., Schofield, K. A., Cook, C. N., Fisher, J. R. B., Cheng, S. H., Christie, A., Cooke, S. J., Dubois, N. S., Frampton, G., Macura, B., Nichols, S. J., Richards, R., Aicher, R. J., Mason, S., Anderson, E., Betley, E., Borsuk, M., Busch, J., Carlson, S., … Ridley, C. E. (2026). A Standardized Definition of Rapid Evidence Assessment for Environmental Applications. Conservation Letters, 19(1), 1–7. https://doi.org/10.1111/con4.70005


Sincerely,
 
Jon
 
p.s. This is a four pound turnip. I bought it at the farmer's market out of curiosity, and split it across two recipes and it was tasty!

Monday, June 2, 2025

June 2025 science summary

Mushroom in West Virginia

Hi,

It occurred to me that since I focused on fire in April and water in May, I should continue with the elemental theme and cover terrestrial papers this month. Doing air/wind in July is unlikely :) It's still a bit of a mix with papers on global threats, forest degradation, protected areas, and wildlife migration.

If you know someone who wants to sign up to receive these summaries, they can do so at http://bit.ly/sciencejon (no need to email me).

GLOBAL THREATS:
Oakleaf et al. 2024 is a long-awaited global analysis of likelihood of short-term (by 2030) habitat conversion (1 km resolution, see Fig 5 for the results). They include not only cropland and city expansion, but also land use change for energy (fossil or renewable) and mining, and considered several suitability factors (like slope and land cover). Their approach assumes recent trends (2000-2015) will continue rather than modeling different scenarios of economic development. Like any global data you can find places where it seems wrong, but it's a great resource nonetheless. You can grab the data at https://figshare.com/articles/dataset/Conversion_Pressure_Index/25340668 or view the data in a web map at https://tnc-ps-web.s3.amazonaws.com/GDRA/CPI/index.html There's also a blog about the paper at https://blog.nature.org/science-brief/mapping-global-land-conversion-to-support-conservation-planning/


FOREST DEGRADATION:
Bourgoin et al. 2024 is a global analysis of degradation of tropical moist forests using LiDAR satellite data (from GEDI) along with Landsat optical imagery. It's worth reading the whole paper, but a few key findings: 1) degradation is hard to sense but a) a good predictor of deforestation in addition to b) being inherently meaningful. 2) Forest height is reduced by selective logging (15%) and fire (50%) and recovery is low after 20 years. 3) Expansion of ag and roads leads to a 20-30% drop in canopy height and biomass at the edge, with effects up to 1.5km in from the edge. Fig 1 has maps of global results - it's a bit confusing but the x-axis of the charts is height in meters, so lower numbers mean more degradation or younger forests. There's an article about this one at https://phys.org/news/2024-07-reveals-human-degradation-tropical-forests.html#google_vignette


EFFICACY OF PROTECTED AREAS:
Huais et al. 2025 looked at the impact of protected areas (PAs) in the Chaco (across Bolivia, Argentina, and Paraguay) in slowing deforestation both within their boundaries and nearby. The bad news: only 34% of PAs actually reduced deforestation within the area, and 9% of PAs actually saw MORE deforestation than expected (with the other 58% seeing no impact). Most of the effective area was in Bolivia (see Fig 3a), although Bolivia also had a lot of PAs they couldn't analyze due to a lack of suitable control / counterfactual areas. In good news, only 4% of PAs saw leakage (deforestation shifting from within a PA to a nearby area - they didn't consider long-distance leakage), and better yet 21% of PAs seemed to decrease deforestation in nearby areas. In other words ~2/3 of the PAs that actually slowed deforestation within their borders ALSO had a broader positive impact (Fig 3b), likely by a) discouraging infrastructure and access to the nearby areas, b) the presence of some Indigenous territories near PAs, and c) buffer areas around each PA.


WILDLIFE MIGRATION:
Aikens et al. 2025 has a nice summary up front already! They found that during a very bad snowstorm (see Fig 1), pronghorn died more when they couldn't get away from deep snow fast enough (Fig 2D). Roads and fences blocking their way meant they were exposed to snow longer (and thus at higher risk). 1/2 of monitored pronghorn (they had GPS collars) died from the storm, and they moved up to 400 km to try and get away! Pronghorn tend to crawl under fences so when snow is deep they may be unable to cross them at all (Fig 3D has a photo).

Haworth et al. 2025 (non-peer-reviewed) looked at a handful of roadways with different kinds of medians (e.g. vegetated, just paint, cable, concrete, or metal guardrail) to compare how medians affected wildlife crossings for different species (see Table 3 on p22). They assert that some species were impacted by median types, and that in general constructed medians lead to fewer animals entering the roadway at all (so less permeability may also reduce collision risk). But when you get into the results it’s less convincing – the pairwise comparisons don’t have any clear trends (except a weak tendency of fewer collisions from harder barriers). Figure 4 also has some weird findings for mule deer (painted stripe saw the most collisions, cable and gravel the lowest, but oddly concrete and metal beam are closer to the painted stripe) and then Figure 5 for coyote shows that painted stripe had the least collisions! My take-away is that either 1) it’s easy for small studies to show effects due to uncontrolled variables, especially for wildlife movement which can vary a lot and/or 2) the relationship is complicated and there’s not a simple policy answer (like X median will best reduce risk of WVC while also allowing wildlife movement).


REFERENCES:
Aikens, E. O., Merkle, J. A., Xu, W., & Sawyer, H. (2025). Pronghorn movements and mortality during extreme weather highlight the critical importance of connectivity. Current Biology, 35(8), 1927-1934.e2. https://doi.org/10.1016/j.cub.2025.03.010

Bourgoin, C., Ceccherini, G., Girardello, M., Vancutsem, C., Avitabile, V., Beck, P. S. A., Beuchle, R., Blanc, L., Duveiller, G., Migliavacca, M., Vieilledent, G., Cescatti, A., & Achard, F. (2024). Human degradation of tropical moist forests is greater than previously estimated. Nature, 631(8021), 570–576. https://doi.org/10.1038/s41586-024-07629-0

Haworth, L., Hodgson, B., Hecht, L., See, M., Henderson, A., Lemieux, S., Morris, L., Waetjen, D., Shilling, F., Haworth, L., Hodgson, B., Hecht, L., See, M., Henderson, A., Lemieux, S., Morris, L., Waetjen, D., & Shilling, F. (2025). Wildlife Connectivity and Which Median Barrier Designs Provide the Most Effective Permeability for Wildlife Crossings. https://doi.org/10.7922/G2BV7DZ6

Huais, P. Y., Kuemmerle, T., Nori, J., Tomba, A. N., Cordier, J. M., & Baumann, M. (2025). Only one-third of protected areas in the Chaco effectively curb woodland loss, but their impact extends beyond their boundaries. Biological Conservation, 308(March), 111196. https://doi.org/10.1016/j.biocon.2025.111196

Oakleaf, J., Kennedy, C., Wolff, N. H., Terasaki Hart, D. E., Ellis, P., Theobald, D. M., Fariss, B., Burkart, K., & Kiesecker, J. (2024). Mapping global land conversion pressure to support conservation planning. Scientific Data, 11(1), 830. https://doi.org/10.1038/s41597-024-03639-9

Sincerely,
 
Jon
 
p.s. this is a lovely mushroom I saw in West Virginia

Thursday, January 2, 2025

Best of 2024 science summaries

Sarah and Jon before Christmas caroling

Happy New Year,


How better to celebrate the new year than with old science?!

As usual, here are my favorite 15 reruns (article summaries) from 2024, plus a few of my favorite bits about AI since I keep getting requests for more of that:

Upset at the articles I missed? Please email me your own favorites from 2024 and I'll do what I can to include them in upcoming summaries.

As always people can sign up to receive these summaries at http://bit.ly/sciencejon (no need to email me). On with the reruns!


CLIMATE CHANGE
OK, for years people have been hyping the potential of a kind of seaweed (Asparagopsis) to reduce methane emissions in cattle. But the in vitro evidence was mixed - with potential toxicity and downsides a concern if the dose wasn't just right. George et al 2024 is a live trial with good news! They found methane emissions from cattle given an Asparagopsis additive were cut roughly in half compared to control, with 6.6% higher weight gain per unit of feed and no substantial impacts on quality or health (fat color maybe a bit better, tenderness maybe a bit worse). The methane reduction peaked at day 21 and declined afterwards, but since most cattle are in feedlots only ~3 months (ranging from 1.5-4) the decline after day 100 is pretty moot. That's a lot of potential! The only potential downsides were ~50% higher bromine residues in kidney and muscle (I couldn't quickly find guidance on safe levels). Caveats: 1) there were no conflicts declared but the authors appear to almost all work as feedlot consultants and it's single rather than double-blinded, 2) in the US the feedlot phase is only about 15% of the lifecycle emissions of a cow (and of that, some is from growing crops and nitrous oxide) so TOTAL impact on CO2e / kg beef is not as dramatic. Overall my take is 1) this should absolutely be tested and replicated more - anything that reduces the very high carbon of beef is worth pursuing. BUT 2) if this is marketed as "green beef" or license to avoid reductions, it could be net harmful for the climate. and 3) IF spraying this solution on grass worked similarly and didn't inhibit development of calves, the impact could be much higher (since ~80%ish of a cow's life is grazing prior to feedlot, and methane emissions are higher on grass than feed). So let's test that too (note: there’s a new study claiming a ~1/3 reduction in methane during grazing via seaweed supplements that I haven’t reviewed yet). There's a blog about this at https://www.theguardian.com/australia-news/article/2024/aug/18/feeding-seaweed-supplement-to-cattle-halved-methane-emissions-in-australian-feedlot-study-finds

Trencher et al, 2024 is an analysis of the quality of carbon credits on the voluntary market. They focus on the 20 companies retiring the most credits between 2020-2023 (134 million metric tons CO2e), which is 20% of all global retirements on the three registries (see Fig 1 for company list). They found 87% of credits have a high risk of not providing real additional reductions (6% were low risk, most of the rest was medium), and 97% of credits focused on avoiding emissions rather than removal. Note that they classified all REDD+ (reducing deforestation and/or degradation) as high risk given that they have often 1) overestimated additionality, 2) not stopped deforestation, and/or 3) displaced deforestation elsewhere (aka 'leakage'). They also classify large-scale renewable energy as high-risk, since the price of credits is not typically the decisive factor in those projects (they are often built w/ or w/o credits) and they are often build in countries w strong government support for renewable energy. They also found that companies strongly prefer the cheapest credits (which creates demand for lower-quality offsets) often from older projects, although some companies have paid a lot more for REDD projects. The authors call for more regulation of the voluntary market, and for companies not using voluntary credits to support claims of offsetting emissions.

 
CONSERVATION IMPACT:
Langhammer et al. 2024 is the big splashy new Science paper looking at the global impact of conservation. It's a meta-analysis of trials comparing interventions to counterfactuals (similar areas w/o action). They found conservation helps 2/3 of the time (45% of trials led to absolute improvement in biodiversity, 21% reduced biodiversity loss), but is harmful 1/3 of the time (in 21% of trials biodiversity declined more due to conservation, in 12% it improved less due to conservation), and only 2% of trials showed no difference). That's not a great track record - I'd hoped net harm would be rare (1/3 is very high!), and just over half the time we're losing biodiversity despite trying to stop it. Fig 2 helpfully shows how impact varies by type of intervention: protected areas show the smallest positive effect on average, and invasive species removal shows the largest positive effect. I'd ignore "sustainable use of species" b/c it's a weirdly broad category that somehow only included 4 papers on wildlife hunting and 1 on fishing, although a few fishing papers are included under protected areas (details in the supplement - this makes me think their sample is not representative of conservation broadly). While the authors conclude conservation is working and we should do more of it, I bet if this was a paper on medical efficacy we'd consider interventions that are 2/3 helpful and 1/3 harmful an urgent cry to improve efficacy BEFORE we try to scale work that is so often ineffective or harmful. Would you send your kids to a school where 1/3 of students learned less than kids not in school at all?


EVIDENCE ASSESSMENTS / SCIENTIFIC REPRODUCIBILITY:
Scientists often complain policy makers don't follow our recommendations (or even read them). But Brisco et al. 2023 finds that recommendations from meta-analyses tend to change over time as research continues. They looked at 79 papers (121 meta-analyses) and found that over time 93% of analyses either had a big change in effect size (+- 50% or more, see Fig 2 for examples) or change in statistical significance (see Fig 3). The key results are in Fig 5, which I find pretty confusing. Results staying consistently statistically significant w/ each study is rare, and ~25% of analyses showed a reversal in effect (from positive to negative or vice versa). Those reversals are the change we care the most about since it means action can backfire. BUT if you ignore the studies that were never statistically significant (seems safe) it's only 12% of analyses that flip, and if you also ignore the ones that lost significance (meaning the reversal is less meaningful) it goes down to 11%. That's still pretty bad though - 1 time out of 9 the scientific recommendation might lead to the opposite outcome we intend. They recommend scientists use cumulative meta-analyses to look for trends, and the reminder that we're often wrong reinforces the need for adaptive management and an empirical approach to seeing what works in a given context.
 
 
FIRE:
Pivello et al. 2021 is a good comprehensive overview of wildfire across Brazil. It's long and dense so hard to summarize! Natural fires are most common at the beginning of the wet season when lightning ignites accumulated dry vegetation. Fig 1 has an overview of fire by biome: the Amazon followed by Cerrado have the most fires; the Pantanal and Cerrado typically have the highest % burned (they are both fire-dependent, as is the Pampas, see Fig 2), and in 2020 the Pantanal had roughly triple the % burned and fire density as others. Pollen evidence (from a different study, Power et al. 2016) indicates fire activity in the Pantanal peaked about 12,000 years ago (people have only lived there for about 8,000 years, and grazed cattle for ~250). Introducing cattle has caused a shift from burning every 3-6 years (mostly in the beginning or sometimes end of the wet season) to burning every year or two during a relatively dry part of the wet season (see Fig 6). Conversely, fire suppression in the Cerrado has also driven woody encroachment of savannas. In the Amazon and Atlantic Forest, natural fire is rare and very infrequent, making fire especially harmful as species are not adapted to it. The combination of deforestation and drought make it much easier for fire to spread (and Amazonian deforestation means more drought in the Pantanal). 1/3 of the forest in the Amazon from 2003-2019 were associated w/ deforestation. Indigenous people mostly used fires in small areas, but since European colonization it's used at larger scales to clear land permanently (or alternately suppressed, see Fig 7 for a nice timeline of fire landmarks). Integrated fire management (IFM) is uncommon (except a few federal protected areas, mostly in the Cerrado). Only Minas Gerais and Roraima states have IFM laws. The authors recommend: 1) fire management policy should include climate mitigation and poverty reduction to reduce fire risk; 2) better fire monitoring and management systems; 3) filling knowledge gaps around drivers of fire, how fire impacts wetlands, human dimensions of fire, impacts of different fire regimes on grazing productivity and carbon; 4) better enforcement of illegal fire use (including more resources); 5) including local communities in developing fire management plans, and 6) national and state level fire policies with adequate resources for implementation (including data collection and sharing, and clear and simple rules about fire use).
 
Balch et al. 2024 found that over the last 20 years fires in the US have been spreading faster. In the Western US over 20 years the average peak daily growth rate (the average of the fastest each fire grew on a given day) increased 2.5 times (in California they increased by 4 times). The fastest 3% of fires nationally (spreading more than 1,620 ha in a day) destroyed between 78-89% of the buildings lost to fire (the paper lists each number in different section for the same stat). I’ve heard a lot more about severity and frequency and extent of fire, but thinking about speed is also important as faster fires are harder to respond do, and may make really smooth coordination increasingly important. Increases in drought conditions and potential increases in high winds could make this worse over time. 


FRESHWATER:
Flitcroft et al. 2023 notes that counting effective freshwater protection globally is really hard (as is getting effective protection to happen). Fig 1 has a nice summary of how restrictive different protection mechanisms are. They also call for both better management of existing protected areas (PAs) to include freshwater conservation needs, and protections for freshwater in new places. While issues around data resolution and data availability continue to pose challenges to freshwater conservation, they argue that more explicit consideration of both freshwater and terrestrial objectives in any area-based protection is a good start.
 
Jasechko et al. 2024 is a global assessment of groundwater levels since 2000 (using 170,000 wells and 1,700 aquifers) and comparing them to earlier trends for ~1/3 of those aquifers. They found 36% of aquifers were drying up (water level dropping deeper by 0.1 m / yr or more), and 6% of aquifers were improving (water level rising 0.1 m / yr or more), w/ 58% of aquifers not changing quickly in this century. 30% of the aquifers where they had 40 years of data declined faster in the 21st century than the 20 years prior (see Fig 3), but in 49% of those aquifers declines slowed or reversed. Unsurprisingly the trend is worst in drylands w/ farmland, and groundwater deepening is globally correlated w/ low precipitation, high evapotranspiration, and extent of agriculture. See Fig 1 and 2 for global map of trends, highlighting hotspots of decline in CA, the US high plains, Iran, India, central Chile, and a few others. There's a news article about the study at https://www.cnn.com/2024/01/24/climate/groundwater-global-study-scn/index.html

Wang et al. 2024 looks at how climate change has changed the seasonality of river flow (how much it varies month to month, including frequency of droughts and floods). They found that ~14% of long-term river gauges show changes in seasonality over the last 50 years that isn't driven by changing annual precipitation. The surprise is that seasonality is mostly DECREASING counter to the narrative of more floods and droughts (see Fig 1 for a map of results, and Fig 2 which adds detail). In their figures brown means less seasonality (more even flow): "L+" means low flows become higher flows (NOT higher frequency of drought) while "H-" means floods see lower flood volume (again NOT lower frequency of flood events). You'll see most of North America, most of Europe, and some of Russia have seen reduced seasonality in recent decades. Blue means MORE seasonality, focused in: SE Brazil, some European countries, and in the US the SE and some of the Rocky Mountains. The explanation is worth reading in full, but in brief: 1) snow melting earlier means less runoff from snow at the same time as spring rains, 2) early spring greening means more water gets transpired, 3) it's more complicated in places not dominated by snowmelt.
 

HORIZON SCANNING / EMERGING ISSUES:
I realized I've only rarely reviewed Bill Sutherland's annual "horizon scan" article listing 15 emerging conservation issues that potentially deserve to be better-known. Last year (I just read the 2024 version a year late) they used artificial intelligence to generate some of the ideas but none made the cut. Here's the final list so you can decide if any are worth looking up (and here’s the brand new 2025 paper if you want to catch up):
1. New sources of hydrogen for energy (mining or electrolysis instead of natural gas),
2. Decarbonized ammonia (making fertilizer w/ lower carbon emissions but could increase fertilizer wasted),
3. Feeding people and/or animals w/ cultivated bacteria,
4. Light-free artificial photosynthesis (yes, it's as weird as it sounds) for indoor ag,
5. Enhanced rock weathering at scale (putting rock dust on croplands to sequester carbon),
6. Potential global declines in earthworm populations (more data is needed to see if UK decline is representative),
7. Ecoacoustics to monitor soil ecology (testing how meaningful soil sounds are for estimating things like biodiversity and water flow),
8. Wildfire affecting El Niño and La Niña phase (aerosols leading to the La Niña phase),
9. Benchtop DNA printers (potential to eventually allow guerilla genetic engineering),
10. Better predicting chemical toxicity from early data,
11. a skyscraper city planned in Saudi Arabia that birds could crash into when migrating from Europe to Africa.,
12. Sea urchin die-offs (possibly from disease) leading to algal overgrowth on corals and other marine ecosystems,
13. Ocean-based carbon removal (from the air or dissolved in water to stable forms),
14. Warming "twilight zones" (200-1000m below sea surface) affecting global nutrient and carbon cycles, and
15. Melting Antarctic ice changing deep sea currents.


MAMMALS:
Greenspoon et. al 2023 is an attempt to estimate the biomass of all wild mammals on earth (combined), arriving at 60 Mt total: 20 Mt (million metric tons) on land (half from "even-hoofed" mammals, see FIg 2), and 40 Mt in oceans (23 Mt of which comes from baleen whales). But the kicker is that they estimate human biomass at 390 Mt, and livestock biomass at 630 Mt (420 Mt from cattle: which is more than all humans plus all wild land mammals). Fig 4 awkwardly tries to compare all mammal biomass on earth, showing how wild species have been squeezed. The wild mammal estimates mostly come from the IUCN red list which skews towards expert assessments of more threatened spp., and the numbers won't be "right" for several reasons (these estimates are hard, and the data are highly limiting). But it seems solid that humans and livestock substantially outweigh wild mammals.
There's a good critique of the paper (arguing that Greenspoon et al. underestimate biomass by a factor of 5.5) by Santini et al. here https://www.pnas.org/doi/10.1073/pnas.2308958121 and a reply from the Greenspoon authors pointing out why the methods used in the critique are also (differently) flawed: https://www.pnas.org/doi/10.1073/pnas.2316314121
 

MIGRATORY SPECIES / WILDLIFE CONNECTIVITY:
The new State of the World's Migratory Species report (UNEP-WCMC 2024) has an update on how the 1,189 migratory species in CMS are doing. Almost half (44%) are in decline (with 22% at risk of extinction, including 97% of listed fish spp), 1/3 are stable, and the rest are split between improving and unknown. The report also notes that 399 spp not even listed in CMS (including ~200 fish spp, ~150 bird spp, and ) are at risk (from critically endangered to near threatened). See Fig 2.10b for an overview of which migratory species CMS leaves out (including horseshoe crabs!) and 2.10c for the subset at risk. Unsurprisingly the main threats are habitat loss (along w/ degradation and fragmentation) and overexploitation (hunting and fishing). Recommendations on page ix-xi are familiar and unsurprising (albeit important). There's a blog about this paper with key highlights at: https://www.unep.org/news-and-stories/press-release/landmark-un-report-worlds-migratory-species-animals-are-decline-and
 
Littlefield et al. 2024 (I'm a minor author) examines how wildlife road crossings can be beneficial to help species adapt to climate change. We recommend that when siting crossings we should consider a) current wildlife movements, AND expected short-term and long-term shifts in species range and migrations due to b) climate change AND c) human land use change (expansion of housing, ag, etc.). We show how doing this was accomplished for elk in Colorado.
For this to work well, diversion fencing is important to channel wildlife to crossings, and avoiding future fragmentation is key. The paper is open access. There's a press release for the paper here: https://fish.freeshell.org/publications/Littlefield2024-PressRelease.pdf


POLLINATORS:
Li et al. 2024 is a methods paper about using land cover data to predict floral resource availability for pollinators. I'm an author despite minimal input; the lead author based this on work by the last author, who I provided some guidance to when he was a postdoc. There are a few potentially interesting things in here. 1) Most pollinators don't make much honey, so their populations are limited by the time of year w/ the least food available (pollen and nectar). The methods here help you figure out those bottlenecks if you want to target habitat restoration to boost pollinator populations. 2) Plants vary a lot in how much nectar and pollen they make. Not every crop makes flowers that feed pollinators (likely obvious, but some crops and cover crops are harvested or terminated before flowering, and wind-pollinated plants don't have nectar). Trees produce a ton of nectar and pollen. 3) The paper looked at two different ways to map land cover, and surprisingly the simpler approach worked as well (similar error levels)! It's a good reminder to always question whether you need more complexity and accuracy. If you just have a garden and want more bees and other pollinators, this blog post I wrote may help: https://sciencejon.blogspot.com/2024/05/new-paper-on-mapping-pollinator.html
 

WETLANDS:
The latest report on the status of wetlands in the US (excluding AK and HI) is a bummer but has some useful info. Key summaries are in Fig 9 and Table 2, but in short on net 221,000 acres of wetlands were converted, mostly to ag and tree plantations followed by housing developments. But that net change hides that fact that we actually lost 670,000 acres of vegetated wetlands, with non-vegetated wetlands like ponds, sandbars, and mudflats increasing (but NOT providing nearly as much ecological value). The report calls for more coordination to achieve no net loss of wetlands, to update and improve the National Wetlands Inventory, develop and implement better wetland conservation and management (duh), and commit to long-term monitoring and adaptive management.


REFERENCES:

Balch, J. K., Iglesias, V., Mahood, A. L., Cook, M. C., Amaral, C., DeCastro, A., Leyk, S., McIntosh, T. L., Nagy, R. C., St. Denis, L., Tuff, T., Verleye, E., Williams, A. P., & Kolden, C. A. (2024). The fastest-growing and most destructive fires in the US (2001 to 2020). Science, 386(6720), 425–431. https://doi.org/10.1126/science.adk5737
 
Brisco, E., Kulinskaya, E., & Koricheva, J. (2023). Assessment of temporal instability in the applied ecology and conservation evidence base. Research Synthesis Methods, November, 1–15. https://doi.org/10.1002/jrsm.1691
 
Flitcroft, R. L., Abell, R., Harrison, I., Arismendi, I., & Penaluna, B. E. (2023). Making global targets local for freshwater protection. Nature Sustainability. https://doi.org/10.1038/s41893-023-01193-7
 
George, M. M., Platts, S. V., Berry, B. A., Miller, M. F., Carlock, A. M., Horton, T. M., & George, M. H. (2024). Effect of SeaFeed, a canola oil infused with Asparagopsis armata , on methane emissions, animal health, performance, and carcass characteristics of Angus feedlot cattle. Translational Animal Science, 8(August). https://doi.org/10.1093/tas/txae116
 
Greenspoon, L., Krieger, E., Sender, R., Rosenberg, Y., Bar-On, Y. M., Moran, U., Antman, T., Meiri, S., Roll, U., Noor, E., & Milo, R. (2023). The global biomass of wild mammals. Proceedings of the National Academy of Sciences, 120(10), 2017. https://doi.org/10.1073/pnas.2204892120

REPLY AND COUNTER-REPLY TO GREENSPOON:

  • Santini, L., Berzaghi, F., & Benítez-López, A. (2024). Total population reports are ill-suited for global biomass estimation of wild animals. Proceedings of the National Academy of Sciences, 121(4), 1–3. https://doi.org/10.1073/pnas.2308958121   
  • Greenspoon, L., Rosenberg, Y., Meiri, S., Roll, U., Noor, E., & Milo, R. (2024). Reply to Santini et al.: Total population reports are necessary for global biomass estimation of wild mammals. Proceedings of the National Academy of Sciences of the United States of America, 121(4), 1–2. https://doi.org/10.1073/pnas.2316314121

Jasechko, S., Seybold, H., Perrone, D., Fan, Y., Shamsudduha, M., Taylor, R. G., Fallatah, O., & Kirchner, J. W. (2024). Rapid groundwater decline and some cases of recovery in aquifers globally. Nature, 625(7996), 715–721. https://doi.org/10.1038/s41586-023-06879-8
 
Lang, M. W., Ingebritsen, J. C., & Griffin, R. K. (2024). Status and Trends of Wetlands in the Conterminous United States 2009 to 2019. U.S. Department of the Interior; Fish and Wildlife Service, Washington, D.C. 43 pp. https://www.fws.gov/project/2019-wetlands-status-and-trends-report

Langhammer, P. F., Bull, J. W., Bicknell, J. E., Oakley, J. L., Brown, M. H., Bruford, M. W., Butchart, S. H. M., Carr, J. A., Church, D., Cooney, R., Cutajar, S., Foden, W., Foster, M. N., Gascon, C., Geldmann, J., Genovesi, P., Hoffmann, M., Howard-McCombe, J., Lewis, T., … Brooks, T. M. (2024). The positive impact of conservation action. Science, 384(6694), 453–458. https://doi.org/10.1126/science.adj6598

Li, K., Fisher, J., Power, A., & Iverson, A. (2024). A map of pollinator floral resource habitats in the agricultural landscape of Central New York. One Ecosystem, 9. https://doi.org/10.3897/oneeco.9.e118634
 
Littlefield, C. E., Suraci, J. P., Kintsch, J., Callahan, R., Cramer, P., Cross, M. S., Dickson, B. G., Duncan, L. A., Fisher, J. R., Freeman, P. T., Seidler, R., Wearn, A., Andrews, K. M., Brocki, M., Dodd, N., Gagnon, J., Johnson, A., Krosby, M., Skroch, M., & Sutherland, R. (2024). Evaluating and elevating the role of wildlife road crossings in climate adaptation. Frontiers in Ecology and the Environment, 1–10. https://doi.org/10.1002/fee.2816
 
Pivello, V. R., Vieira, I., Christianini, A. V., Ribeiro, D. B., da Silva Menezes, L., Berlinck, C. N., Melo, F. P. L., Marengo, J. A., Tornquist, C. G., Tomas, W. M., & Overbeck, G. E. (2021). Understanding Brazil’s catastrophic fires: Causes, consequences and policy needed to prevent future tragedies. Perspectives in Ecology and Conservation, 19(3), 233–255. https://doi.org/10.1016/j.pecon.2021.06.005
 
Sutherland, W. J., Bennett, C., Brotherton, P. N. M., Butchart, S. H. M., Butterworth, H. M., Clarke, S. J., Esmail, N., Fleishman, E., Gaston, K. J., Herbert-Read, J. E., Hughes, A. C., James, J., Kaartokallio, H., Le Roux, X., Lickorish, F. A., Newport, S., Palardy, J. E., Pearce-Higgins, J. W., Peck, L. S., … Thornton, A. (2024). A horizon scan of global biological conservation issues for 2024. Trends in Ecology & Evolution, 39(1), 89–100. https://doi.org/10.1016/j.tree.2023.11.001
 
Trencher, G., Nick, S., Carlson, J., & Johnson, M. (2024). Demand for low-quality offsets by major companies undermines climate integrity of the voluntary carbon market. Nature Communications, 15(1), 6863. https://doi.org/10.1038/s41467-024-51151-w
 
UNEP-WCMC, 2024. State of the World’s Migratory Species. UNEP-WCMC, Cambridge, United Kingdom.
https://www.cms.int/en/publication/state-worlds-migratory-species-report
 
Wang, H., Liu, J., Klaar, M., Chen, A., Gudmundsson, L., & Holden, J. (2024). Anthropogenic climate change has influenced global river flow seasonality. Science, 383(6686), 1009–1014. https://doi.org/10.1126/science.adi9501


Sincerely,
 
Jon
 
p.s. I inherited that Christmas sweater from my dad, and typically only pull it out once a year for a Christmas sing-along

Thursday, February 1, 2024

February 2024 science summary

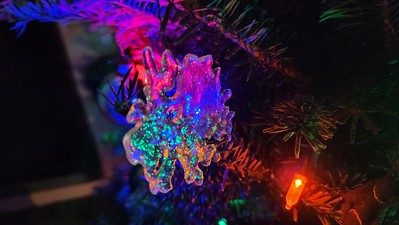
Snowflake ornament illuminated by Christmas tree lights

 Hello,


This month is a bit of a grab bag again with an article on freshwater protection, another on koala-vehicle strikes, and two on soil carbon (both offering caution on the potential and flagging complexity).

If you know someone who wants to sign up to receive these summaries, they can do so at http://bit.ly/sciencejon (no need to email me).

FRESHWATER:
Flitcroft et al. 2023 notes that counting effective freshwater protection globally is really hard (as is getting effective protection to happen). Fig 1 has a nice summary of how restrictive different protection mechanisms are. They also call for both better management of existing protected areas (PAs) to include freshwater conservation needs, and protections for freshwater in new places. While issues around data resolution and data availability continue to pose challenges to freshwater conservation, they argue that more explicit consideration of both freshwater and terrestrial objectives in any area-based protection is a good start.


WILDLIFE-VEHICLE CONFLICTS:
Dexter et al. 2023 makes a point that seems obvious once you think about it, but which was new to me. Namely, hotspots of wildlife-vehicle collisions (they looked at koala strikes) are likely to be very dynamic over time as wildlife populations grow and shrink, as land use change drives shifts in their movement, and as roads and traffic change. They make the point that wildlife crossings are generally cited based on past collision data, and found that collision hotspots decline over time (as nearby populations decline and/or move). There was some unspecified 'road mitigation' which could have partially driven the reductions but the authors said the mitigation wasn't sufficient to explore the decline (pointing to unpublished data, unfortunately). They recommend instead taking a broader landscape approach considering habitat and trends as opposed to focusing crossings at local collision hotspots, and including crossings or other mitigation early when making infrastructure changes.


SOIL CARBON:
Ogle et al. 2023 looks at the soil carbon portion of U.S. plans to meet their contribution to the Paris agreement on climate mitigation. They review several well known challenges w/ soil carbon (C): changes are hard to predict and measure accurately, that additionality and permanence can be challenges, and that changing practices can have undesirable side-effects (increasing emissions from soil of strong GHGs like nitrous oxide or methane, shifting emissions to other farms, etc.). See Table 1 for a summary. They also provide an overview of policy options including mandates, subsidies and incentives, C taxes, and C offsets (see Table 2). They call for a suite of research to investigate these challenges and look for a path forward if one exists.

Wang et al. 2023 is a helpful review of the degree to which soil carbon sequestration can offset greenhouse gas (GHG) emissions from ruminants (mostly cattle, but also sheep, goats, and buffaloes). It's a nice example of fairly simple analysis revealing important insights. Their top level finding is that to offset ruminant emissions from manure and burping over a 100 year timeframe, we would need to roughly triple the current total global carbon stock in managed grasslands (adding 200% to existing stocks), with regional increases needed from ~25%-2000% (Fig 4b, and see 4c which is per ha). That large an increase is not feasible; while reducing net emissions on ranches is important, we shouldn't expect to get the global beef & other ruminant sector to help mitigate climate change on net. That's perhaps obvious, but fringe local cases of low-density ranches w/ lots of nature potentially being carbon negative are often cited as examples of something globally scalable, so it's a useful reminder that they are not unless we reduce the global supply of ruminants (farm and eat less of their meat and dairy). Fig 3 summarizes how cattle factor into this in a different way: depending on how a given grassland can sequester and how much methane each cow produces, the "offsettable" cattle density ranges from 0 to 1.2 (for the very best case scenario).


REFERENCES:
Dexter, C. E., Scott, J., Blacker, A. R. F., Appleby, R. G., Kerlin, D. H., & Jones, D. N. (2023). Koalas in space and time: Lessons from 20 years of vehicle‐strike trends and hot spots in South East Queensland. Austral Ecology, June 2021, 1–18. https://doi.org/10.1111/aec.13465

Flitcroft, R. L., Abell, R., Harrison, I., Arismendi, I., & Penaluna, B. E. (2023). Making global targets local for freshwater protection. Nature Sustainability. https://doi.org/10.1038/s41893-023-01193-7

Ogle, S. M., Conant, R. T., Fischer, B., Haya, B. K., Manning, D. T., McCarl, B. A., & Zelikova, T. J. (2023). Policy challenges to enhance soil carbon sinks: the dirty part of making contributions to the Paris agreement by the United States. Carbon Management, 14(1). https://doi.org/10.1080/17583004.2023.2268071

Wang, Y., de Boer, I. J. M., Persson, U. M., Ripoll-Bosch, R., Cederberg, C., Gerber, P. J., Smith, P., & van Middelaar, C. E. (2023). Risk to rely on soil carbon sequestration to offset global ruminant emissions. Nature Communications, 14(1), 7625. https://doi.org/10.1038/s41467-023-43452-3
Sincerely,
 
Jon
 
p.s. This is a photo of a handmade glass snowflake ornament reflecting and transmitting several colors of Christmas tree lights

Wednesday, June 1, 2022

June 2022 science summary

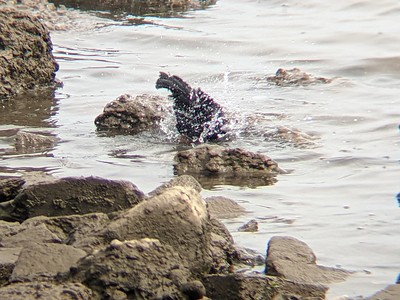
Red-winged blackbird

Greetings,


This month I only have three science articles but they're all good'uns.

If you know someone who wants to sign up to receive these summaries, they can do so at http://bit.ly/sciencejon (no need to email me).

PROTECTED AREAS:
Sullivan-Stack et al. 2022 is a great summary of marine protected areas (MPAs) in the U.S., and flags that achieving 30% U.S. ocean protection by 2030 is not on track to provide sufficient benefit to marine ecosystems. The key finding that stood out to me was the need for improving both geographic representation and efficacy / strength of protection (as well as climate resilience and equity). U.S. oceans are 26% protected overall (25% fully or highly protected), but 96% of that is in the central Pacific ocean. Excluding that region, only 2% has any protection (and only 22% of that 2% is fully or highly protected). See Table 3 for a summary of how much of each region is protected and at what level (Figure 1 has a map but it's not split by protection strength). Alaska has the lowest % protection of any kind (0.7%) while OR & WA have the weakest protection (4.2% of ocean is protected, but that's all minimal protection). Skip to section 4 for their recommendations: create more effective MPAs (via new ones and strengthening existing ones), improve representation of different marine regions & species & habitats in well-connected MPAs, improve equity & access, go beyond tracking % coverage and include impact assessments, make MPAs durable and climate resilient, coordinate state MPAs, reinstate and empower the MPA Federal Advisory Committee, strengthen & fund the NOAA MPA Center, and update the U.S. National Ocean Policy for holistic ocean planning and management.


ECOSYSTEM INDICATORS:
Nicholson et al. 2021 is chock full of useful diagrams and lists. They have a number of recommendations for setting ecosystem goals (which have milestones, targets, and indicators) for a global biodiversity framework, but which can be relevant to other efforts (like 30x30). At a high level they flag the need to track not only total ecosystem/habitat area (or extent), but also changes in ecosystem integrity (including the risk of ecosystem collapse - see Box 2 for definitions). Fig 2 is a nice visual summary of how different types of targets can collectively capture different threats and ecosystem attributes that need to be addressed for long term ecosystem health. Fig 3 is a super helpful review of many different environmental indices / metrics, and what aspects of ecosystems they include and omit. Spend some time with that one - even learning about all of the indices was very helpful for me. They close with 6 recommendations for picking indicators: we need a set of them (no single one suffices), they need to reflect goals (not actions), relevance to the goal is at least as important as data availability, we need more testing and validation of indicators, we need stronger connections between global indicators and national or local policies, and we need new indicators to provide early warning of ecosystem collapse.


ECOSYSTEM CONDITION:
There are good remote sensing data for land cover change, worse but decent data for land use change, but generally not much on degradation (which means we can underestimate ecological decline). Swaty et al. 2021 describe a "Vegetation Departure" (VDEP) spatial data set for the US which gets at this. This includes whether early or late successional stages are over-represented or under-represented (think of a logged forest w/ no old growth left but plenty of young forest, or a grassland being taken over by denser shrubs which were historically less common). They highlight several limitations of the existing LANDFIRE VDEP data (which focuses on canopy cover and height), and recommend that users consider other attributes that are important to their ecosystems of interest (e.g., biodiversity, wildlife populations, wildfire risk, etc.).


REFERENCES:

Nicholson, E., Watermeyer, K. E., Rowland, J. A., Sato, C. F., Stevenson, S. L., Andrade, A., Brooks, T. M., Burgess, N. D., Cheng, S.-T., Grantham, H. S., Hill, S. L., Keith, D. A., Maron, M., Metzke, D., Murray, N. J., Nelson, C. R., Obura, D., Plumptre, A., Skowno, A. L., & Watson, J. E. M. (2021). Scientific foundations for an ecosystem goal, milestones and indicators for the post-2020 global biodiversity framework. Nature Ecology & Evolution, 5(10), 1338–1349. https://doi.org/10.1038/s41559-021-01538-5

Sullivan-Stack, J., Aburto-Oropeza, O., Brooks, C. M., Cabral, R. B., Caselle, J. E., Chan, F., Duffy, J. E., Dunn, D. C., Friedlander, A. M., Fulton-Bennett, H. K., Gaines, S. D., Gerber, L. R., Hines, E., Leslie, H. M., Lester, S. E., MacCarthy, J. M. C., Maxwell, S. M., Mayorga, J., McCauley, D. J., … Grorud-Colvert, K. (2022). A Scientific Synthesis of Marine Protected Areas in the United States: Status and Recommendations. Frontiers in Marine Science, 9(May), 1–23. https://doi.org/10.3389/fmars.2022.849927

Swaty, R., Blankenship, K., Hall, K. R., Smith, J., Dettenmaier, M., & Hagen, S. (2021). Assessing Ecosystem Condition: Use and Customization of the Vegetation Departure Metric. Land, 11(1), 28. https://doi.org/10.3390/land11010028


Sincerely,
 
Jon
 
p.s. The photo above is of a red-winged blackbird bathing in the Potomac River at Dyke Marsh

Tuesday, February 1, 2022

February 2022 science summary

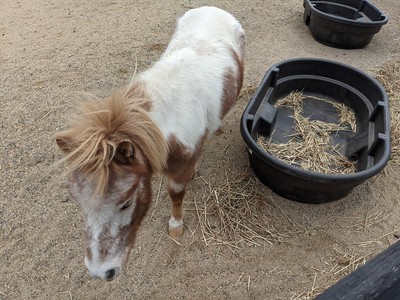
Pineapple the 29" tall mini horse

Hi all,


January was a bit bananas so I've only got summaries of three papers on protected areas this month (efficacy of Indigenous protected areas, recommendations to improve North American connectivity, and the importance of inventoried roadless areas in US national forests).

If you know someone who wants to sign up to receive these summaries, they can do so at http://bit.ly/sciencejon

PROTECTED AREAS:
Sze et al. 2021 compares deforestation and degradation on protected Indigenous lands, unprotected Indigenous lands, protected non-Indigenous lands, and unprotected non-Indigenous lands. Their abstract slightly misrepresents their results, which found that Indigenous lands in the tropics typically provide modest protection against deforestation and degradation, roughly similar to formal protected areas (whether Indigenous or not). The results vary by geography; in Africa unprotected Indigenous lands do even better than protected areas by most measures, but in the Americas Indigenous lands (whether protected or not) fared worse than non-Indigenous protected areas, although still better than non-Indigenous unprotected areas. In some other cases Indigenous lands seem to offer little to no improvement over unprotected non-Indigenous lands. Just comparing non-Indigenous protected areas to Indigenous protected areas, in a slight majority of cases deforestation and degradation are higher in the IPAs (but with some exceptions being similar, and degradation in Asia-Pacific being lower in IPAs); this is surprising given the other findings and makes me think that their matching process (to control for confounding variables) didn't catch everything. Another way to look at their results is that in ~90% of cases they evaluated (the 36 dark lines in Fig 2, considering both geography and data source), both protected areas and Indigenous lands (whether protected or not) experience less deforestation and degradation than unprotected non-Indigenous areas). In the remaining ~10% of cases unprotected and non-Indigenous areas have either similar levels of deforestation and degradation to protected and/or Indigenous lands, or less deforestation and degradation. Overall, the main take-away on efficacy of Indigenous lands for protection is “promising but it depends.” Their results really depend on their matching process (since without it deforestation and degradation is actually lowest in non-protected and non-Indigenous areas in a slight majority of cases). It looks like the matching should correct for confounding factors like Indigenous areas tending to be located farther from development and on lower-value lands. Most of the differences they find are pretty small. So I end up concluding that in this paper Indigenous lands are very roughly on par with protected areas, but that it’s not definitive and depends on geography.

Barnett et al. 2021 model ecological connectivity across North America to make recommendations for protected areas that best retain connectivity. The interesting part of the paper is the comparison between circuit theory and least cost approaches and how they affect recommendations. Least cost assumes species have perfect knowledge about the landscape, which is obviously untrue but over generations if individuals explore a bit on their route those routes can improve as they learn. Having the map of priorities is not terribly useful, especially since this one is based on human modification data but w/ no calibration or validation using wildlife data. The paper I wish they had written was to actually compare both modeling approaches with empirical data on wildlife movement! Essentially asking what each model gets right and wrong, and make recommendations about which approach is more useful / accurate in what context, and whether a new paradigm is needed. In my own work I’ve learned to deeply discount the value of any model which isn’t first calibrated against real world data, and then validated against other real world data not used to build the model.

Dietz et al. 2021 look at inventoried roadless areas (IRAs) in national forests in the US lower 48 states, and how important they are to vertebrate wildlife species of conservation concern (SCC - defined broadly as any of: listed under Endangered Species Act, IUCN vulnerable or worse, or NatureServe vulnerable or worse either nationally or globally, 31% of all vertebrate wildlife species). They found 57% of SCC had at least some habitat on roadless areas, and 99% of the area in IRAs provided habitat for at least one SCC. Since they're looking at about 1/3 of wildlife species, it's not shocking that intact / undeveloped forests typically provide habitat to at least SOME of those species (although as they note, since IRAs don't exist for non-forest habitats it's still impressive). The policy implications are tricky - the authors argue IRAs are good candidates for strengthening protection, but on the other hand one could argue that focusing on intact areas with less protection than IRAs would offer more benefit.


REFERENCES:
Barnett, K., & Belote, R. T. (2021). Modeling an aspirational connected network of protected areas across North America. Ecological Applications, 31(6), 1–7. https://doi.org/10.1002/eap.2387

Dietz, M. S., Barnett, K., Belote, R. T., & Aplet, G. H. (2021). The importance of U.S. national forest roadless areas for vulnerable wildlife species. Global Ecology and Conservation, 32(November), e01943. https://doi.org/10.1016/j.gecco.2021.e01943

Sze, J. S., Carrasco, L. R., Childs, D., & Edwards, D. P. (2021). Reduced deforestation and degradation in Indigenous Lands pan-tropically. Nature Sustainability, 2. https://doi.org/10.1038/s41893-021-00815-2

Sincerely,
 
Jon

p.s. Pictured above is Pineapple the 29" tall mini horse. I took this photo at an event where kids in hospice (or with family members in hospice) got to hang out with horses

Wednesday, December 1, 2021

December 2021 Science Summary

Yellowjacket on bird bath

Happy December,


This month I have three articles all about how we can do better at conservation!

The first one (Guadagno et al. 2021) is about how we can get better at learning from failure and improving on success (as individuals, teams, and organizations) - make time to read this one (or at least skim the sections that look most relevant to you). It's worth it. The next one (LeFlore et al. 2021) looked at what aspects of research led to it being used to inform decision-making. And Pressey et al. 2021 argues that by focusing on area of protection (rather than avoided habitat and species loss), conservation is having less impact than we hope for.

If you know someone who wants to sign up to receive these summaries, they can do so at http://bit.ly/sciencejon

LEARNING FROM FAILURE:
Guadagno et al. 2021 is an an excellent new report from the Wildlife Conservation Society (as part of the Failure Factors Initiative) looking at the experience of conservation NGOs with using “pause and reflect” sessions to learn from failure (and success). Here are my key take-aways:

  • People are reticent to talk publicly about failure for fear of losing respect, status and support for their work.
  • Documenting “lessons learned” in reports is not as important as staff going through the process of talking together and informally learning from each other.
  • Regularly reflecting on both what is working well and what could be improved (even for minor things, and for both successes and failures) makes teams better equipped to respond to serious or major failures (see Example 4 on p14). Having already built both trust and familiarity with a healthy way to learn from failure is excellent preparation when crises arise, allowing the group to work together to pivot effectively. These sessions don't have to take much time.
  • Those regular reflections work best when there is high psychological safety (be respectful, focus on what happened and what to do next time and not who is to blame, recognize and address bias) and they are structured around a few core questions (what did we expect to happen vs. what happened, what went well and why, what can be improved and how). See page 21-25 for recommendations on how to do this, as well as guides / questions you can use.
  • Sometimes a failure looks like a success at first, and in these reflections you can look for other explanations for apparent success (as per Example 1 on p7) allowing you to identify hidden problems and resolve them.
  • Other times, a failure is at least partially a success, and these sessions can also identify some aspects of work going well even when we don’t achieve the outcomes we hoped for (see Example 2 on p11). Also even successes can probably be improved! (see Example 3 on p13).


RESEARCH IMPACT:
LeFlore et al. 2021 looks at factors that tend to result in research being used via a focus on 40 small-scale conservation research projects on the Salish Sea. They found having a government collaborator was key, as was stakeholder engagement throughout the process, and that publishing a journal article didn't increase the chances of the research being used to inform decision-making. The impact bit was self-reported so I was pretty surprised only 40% of the projects were reported as leading to impact! It's hard to know how generalizable their results are, but I think it's fair to ask researchers to compare the time it takes to substantially engage w/ decision makers and other stakeholders, compare that to the time needed to publish, and to reflect on which is a higher priority use of their time. Full disclosure: I was a peer-reviewer of this paper.


PROTECTED AREAS:
Pressey et al. 2021 is an opinion piece arguing that conservationists need to shift focus from area-based protection targets (even those including representation) to avoided biodiversity loss (species extinction and habitat destruction) and ecological recovery. They make a fair and important point: despite increasing protection, the overall global trend of species and habitat loss isn't declining. So protected areas aren't working effectively (whether they're not managed well, or in the wrong places, or there still aren't enough of them, or a mix). That's hard to argue with, and it's key that we find a way to better mitigate acute threats. But they lose me when they call for a lot more modeling of counterfactuals and monitoring of outcomes relative to the modeling. I've done that modeling, and it's slow, expensive, and subject to lots of assumptions and uncertainty. So rather than shifting lots of implementation dollars to more science, I'd favor using 'just enough' science to identify key needs for conservation, push advocacy to focus more on those needs than is currently happening, and do more spot monitoring to check efficacy and adapt.


REFERENCES:
Guadagno, L., Vecchiarelli, B. M., Kretser, H., & Wilkie, D. (2021). Reflection and Learning from Failure in Conservation Organizations: A Report for the Failure Factors Initiative. https://doi.org/10.19121/2021.Report.40769

LeFlore, M., Bunn, D., Sebastian, P., & Gaydos, J. K. (2021). Improving the probability that small‐scale science will benefit conservation. Conservation Science and Practice, October. https://doi.org/10.1111/csp2.571

Pressey, R. L., Visconti, P., McKinnon, M. C., Gurney, G. G., Barnes, M. D., Glew, L., & Maron, M. (2021). The mismeasure of conservation. Trends in Ecology & Evolution, 36(9), 808–821. https://doi.org/10.1016/j.tree.2021.06.008

Sincerely,
 
Jon
 
p.s. Anyone know what species of ground yellowjacket this is? It was drinking from the rim of my birdbath!

Thursday, July 1, 2021

July 2021 science summary

Milkweed beetle

 Hello,


This month I've got a few papers on protected areas and three important papers about the role of forests in climate change. The photo above is just a milkweed beetle from my garden whose eye is bisected by its antenna!

Since there's been a lot of interest lately in protected areas and 30x30, I pulled together summaries of some of my favorites here: http://sciencejon.blogspot.com/2021/06/some-papers-on-30-x-30-and-protected.html

If you know someone who wants to sign up to receive these summaries, they can do so at http://bit.ly/sciencejon


PROTECTED AREAS:
Barnes et al. 2018 highlights the downside of area targets: they may drive siting protected areas (PAs) in bad places and poor enforcement / management. They promote a shift to outcome-based protected area targets (meaning the targets are about biodiversity gains or avoided losses), emphasizing representation and connectivity, and building the evidence base for which factors affect how well PAs deliver conservation outcomes.

Devillers et al. 2015 argues that marine protected areas (MPAs) have largely been cited in remote areas with low threats that the MPAs are intended to address. They point out that politics drive MPAs to be established in places that minimize costs and conflicts with commercial interests, but that MPAs that avoid potential conflicts will by definition have low impact relative to business as usual. They offer two Australian case studies and in particular highlight how well the 2004 rezoning of the great barrier reef was done in terms of improving ecological representation, although still with room to improve. They suggest planners of MPAs and/or no-take zones ask four questions: 1. Are MPAs intended to protect biodiversity? 2. Do proposed MPAs give precedence to more threatened biodiversity features? 3. Do MPAs adequately represent all biodiversity features of interest? and 4. Do MPAs adequately represent variation within features (like bioregions) to focus on the most threatened sub-areas?

Waldron et al. 2020 looks at global financial implications of 30 x 30 (6 terrestrial and 5 marine scenarios), and for tropical forests & mangroves adds in avoided costs and non-monetary ecosystem service values. They estimate that expanding protected areas (PAs) to 30% could result in increased direct global revenues of $64-454 billion / yr (depending on the scenario chosen, and mostly driven by increased nature tourism, see Table 3) as well as more food and wood production. Broader economic benefits (largely from avoided storm damage) could be $170-534 billion / yr more. With a estimated cost of $103-$178 billion / yr (which includes funding to manage existing PAs), they find net economic benefits to 30x30 across all scenarios (spend some time with Table 3 to see the details, but $235 billion / yr is the lowest net financial benefit). It's hard to vet this kind of complex analysis with a ton of assumptions. My gut tells me this is a pretty optimistic assessment due to several key assumptions (like a social cost of carbon at $135-540 / t CO2e , assuming big tourism increases and scarcity of wood driving up forest product revenue, etc.). But they point out that it could be an underestimate since they didn't include broader benefits of other ecosystems like grasslands. Thoughts welcome! Note that other scientists criticized the Waldron paper, noting that not nearly enough has been done to estimate how 30x30 would affect people (nor to consult with them), among other issues. The critique (Agrawal et al. 2020) is here: https://openlettertowaldronetal.wordpress.com/

Wenzel et al. 2020 (NOAA’s 2020 Marine Protected Area report) has a good overview of marine (and great lakes) protection in the U.S. 26% of US waters are in an MPA, but only 3% in a no-take zone. Page 5 of the PDF has a breakdown by region showing that some places like Alaska are disproportionately unprotected. The report also indicates MPA coverage by habitat type (e.g. 83% of mangroves are protected), calls for OECMs to improve MPA connectivity, and notes the need for better management of MPAs.


CLIMATE CHANGE:
As a number of NGOs look to invest in reforestation and forest protection as part of the solution to climate change, Williams et al. 2021 has a very important caveat. They found that while forests cool the earth by sequestering and storing carbon, they can also warm the earth in some cases by absorbing more heat than bare ground or snow would. So some forest loss in the U.S. (lower 48 where they did their modeling) has led to net cooling, even though overall it has led to warming. The cooling mostly happened in the Western US where there’s a lot of snow cover and the arid conditions make for light-color, reflective soils (so losing trees results in less local heat absorption). This paper is more pessimistic than the others I’ve read about temperate forests (for example Li et al. 2015 used remote sensing to actually measure temperature changes and compare nearby pixels with forest vs. open land cover) and finds that 15 years of forest loss only caused warming equal to 17% of a U.S. annual fossil fuel emissions (because the most forest loss has happened in Western states with lots of snow cover, balancing out more moderate forest loss elsewhere). Other work on this topic has found that boreal forests are the most likely to cause net warming (as per Mykleby et al. 2017), but for tropical forest accounting for evapotranspiration and albedo actually enhances their net cooling effect.

Mykleby et al. 2017 estimates how planting trees would affect climate change (both globally and locally) in Canada and the Nothern U.S. They found that in Northern Canada and some Western U.S. states, planting trees would on net warm the earth because the carbon gained is more than outweighed by covering up highly reflective snow with more absorbent tree leaves (Figure 2c). The key point here is that the impact of adding or losing trees depends a lot on location (consistent w/ Williams et al. 2021 and Betts et al. 2000), so tables w/ averages across regions (like Table 1) are not super helpful. This concern with albedo causing local warming is most significant for boreal forests, followed by temperate forests in snowy regions, and does not apply to tropical forests.

Randerson et al. 2006 is another paper looking at how boreal forest loss affects climate change. They used a 1999 boreal forest fire in Alaska as a case study, measuring not only carbon dioxide and methane, but also albedo changes (from exposing snow and ice which reflect more light, and from black carbon deposition which absorb more light) and aerosols in the burned site compared to a control site. They found that for the first ~15 years, the emissions from the fire outweigh the lower albedo and result in net warming. But after 15 years, the fire has a net cooling effect as the GHGs and black carbon and aerosols dissipate, but higher albedo persists (Fig 3b, green line).


REFERENCES:

Barnes, M. D., Glew, L., Wyborn, C., & Craigie, I. D. (2018). Prevent perverse outcomes from global protected area policy. Nature Ecology & Evolution, 2(5), 759–762. https://doi.org/10.1038/s41559-018-0501-y

Devillers, R., Pressey, R. L., Grech, A., Kittinger, J. N., Edgar, G. J., Ward, T., & Watson, R. (2015). Reinventing residual reserves in the sea: are we favouring ease of establishment over need for protection? Aquatic Conservation: Marine and Freshwater Ecosystems, 25(4), 480–504. https://doi.org/10.1002/aqc.2445

Betts, R. A. (2000). Offset of the potential carbon sink from boreal forestation by decreases in surface albedo. Nature, 408(6809), 187–190. https://doi.org/10.1038/35041545

Li, Y., Zhao, M., Motesharrei, S., Mu, Q., Kalnay, E., & Li, S. (2015). Local cooling and warming effects of forests based on satellite observations. Nature Communications, 6, 1–8. https://doi.org/10.1038/ncomms7603

Mykleby, P. M., Snyder, P. K., & Twine, T. E. (2017). Quantifying the trade-off between carbon sequestration and albedo in midlatitude and high-latitude North American forests. Geophysical Research Letters, 44(5), 2493–2501. https://doi.org/10.1002/2016GL071459

Waldron, A., Adams, V., Allan, J., Arnell, A., Asner, G., Atkinson, S., Baccini, A., Baillie, J. E., Balmford, A., Austin Beau, J., Brander, L., Brondizio, E., Bruner, A., Burgess, N., Burkart, K., Butchart, S., Button, R., Carrasco, R., Cheung, W., … Zhang, Y. (2020). Protecting 30% of the planet for nature: costs, benefits and economic implications.

Wenzel, L., D’Iorio, M., Wahle, C., Cid, G., Canizzo, Z., & Darr, K. (2020). Marine protected areas 2020: Building effective conservation networks. https://nmsmarineprotectedareas.blob.core.windows.net/marineprotectedareas-prod/media/docs/2020-mpa-building-effective-conservation-networks.pdf

Williams, C. A., Gu, H., & Jiao, T. (2021). Climate impacts of U.S. forest loss span net warming to net cooling. Science Advances, 7(7), 1–7. https://doi.org/10.1126/sciadv.aax8859

Sincerely,
 
Jon

Wednesday, June 9, 2021

Some papers on 30 x 30 and protected areas in general

Lately I've been reading a lot of science papers related to protected areas and 30x30: the idea of protecting (and/or 'conserving') 30% of the earth by 2030. I thought it might be helpful to share all of the summaries I have on the topic in one place. As always, these summaries are my personal opinion only, and I welcome input / critique / etc.


Specific to recommendations for 30 x 30 in the US:

Simmons et al. 2021 (a non-peer-reviewed white paper) looks at a few options to meet 30 by 30 in the U.S. (protecting 30% of the country on land by 2030) with four different focal objectives (all also minimizing acquisition cost): area alone, carbon sequestration and avoided emissions, landscape connectivity, and climate-resilient species and habitat. It’s a fairly coarse and simplistic assessment, but it does a good job highlighting the kinds of tradeoffs to consider when deciding which lands we advocate for protecting. Check out Figure 2 which shows how their four scenarios perform (on cost, ecosystem representation, and climate mitigation) and where they would protect across the lower 48 states. They close with recommending clear objectives to prioritize where to protect, focus protections on threatened areas, develop metrics to track progress and impact (including on issues like social equity), and use diverse options (beyond traditional protected areas) to provide protection. Check out the appendix for maps showing which areas are already somewhat protected (as GAP 3).

Jenkins et al. 2015 highlights an inconvenient truth about protected areas in the United States: they are mostly located in places with relatively low species richness and threats of conversion. In other words, if the main goal of protected areas is to prevent as many species as possible from going extent, they're poorly sited. You can compare biodiversity maps in Fig 1 & 2 to PAs in Fig 3 to see the mismatch. Fig 4 has their recommendations for 9 areas where conservation should be focused in the SE and West coast. 

Other papers on protection targets etc.:

Barnes et al. 2018 highlights the downside of area targets: they may drive siting protected areas (PAs) in bad places and poor enforcement / management. They promote a shift to outcome-based protected area targets (meaning the targets are about biodiversity gains or avoided losses), emphasizing representation and connectivity, and building the evidence base for which factors affect how well PAs deliver conservation outcomes.

Bhola et al. 2020 sums up four different philosophies or perspectives for setting global conservation goals. 1) extending Aichi biodiversity target #11 (protecting & managing 17% of land and inland water, plus 10% coastal and marine, while considering biodiversity, equity, ecosystem services, and connectivity) to 2030 and ensuring the qualitative piece is achieved. 2) Big area-based goals like 'half earth' or protecting 30% of the earth by 2030 (still ensuring that the right places get protected). 3) ‘New conservation’ (broadening the tent for conservation via ecosystem services, ecotourism, and the private sector). 4) ‘Whole earth’ conservation which attacks root causes of habitat loss like inequality and economic growth (while arguing against separating people from nature). It's a quick read but start w/ Table 1 for a summary of the four perspectives, and Figure 1 which shows how the choice of goal (in this case, biodiversity vs. ecosystem service production) affects which areas you’d want to protect.

Devillers et al. 2015 argues that marine protected areas (MPAs) have largely been cited in remote areas with low threats that the MPAs are intended to address. They point out that politics drive MPAs to be established in places that minimize costs and conflicts with commercial interests, but that MPAs that avoid potential conflicts will by definition have low impact relative to business as usual. They offer two Australian case studies and in particular highlight how well the 2004 rezoning of the great barrier reef was done in terms of improving ecological representation, although still with room to improve. They suggest planners of MPAs and/or no-take zones ask four questions: 1. Are MPAs intended to protect biodiversity? 2. Do proposed MPAs give precedence to more threatened biodiversity features? 3. Do MPAs adequately represent all biodiversity features of interest? and 4. Do MPAs adequately represent variation within features (like bioregions) to focus on the most threatened sub-areas?

Hannah et al. 2020 estimates that effectively conserving 30% of tropical land could cut predicted species extinction by ~1/2-2/3 (if the conserved areas are both cited ideally and managed well: this is not about legal protection alone). Conserving 50% could reduce extinction by more like 2/3-80% (see Table 1 for details including how this varies by region). This is useful to understand how effective conservation can be at different scales. But it's important to note that citing PAs in ideal locations continues to be elusive, this model relies on fairly simple assumptions using species-area curves, and the fact that the results didn't vary much with climate change (RCP2.6 vs RCP 8.5) is concerning. Nonetheless, this could be motivating to highlight the importance of protecting and managing enough of the right places on earth to slow species extinction.

Jantke et al. 2019 proposes a clever way to ensure that "% protected" goals like 30 by 30 (protecting 30% of a country on land and water by 2030) don't focus on easy to protect habitat types while other habitat types remain mostly unprotected. They suggest reporting “mean target achievement” where the % protected of each habitat type would be averaged and compared to a habitat-level goal (See section 2.2 for the equation - crucially achievement maxes out at 100% so overprotection in one habitat can't compensate for underprotection in another). They use Australia's Commonwealth Marine Reserve as an example; it protects 43% of the five marine regions it covers, but still falls short of its goal of protecting at least 10% of each of the 53 bioregions within it. This is a great complement to the total % protected indicator, as ecological representation has badly lagged behind total protection, and the rush to protect a lot more area very quickly will make it very tempting to focus on the easiest habitats to protect even though many other habitats have little to no protection.

Mogg et al. 2019 looks at how much protection is needed to keep land mammals healthy. They assume every species needs 80% of its range protected (plus 10% more as buffer), so Oceania and South America need more than 70% of their land to be protected! They ignore any considerations about meeting demand for food or livelihoods, and it’s odd to me to see the focus on making protected areas much larger much faster given that the paper’s intro mentions that enforcement of current PAs is a major problem. It’s definitely an interesting analysis, but I think it’s really hard to try and get support behind a proposal that doesn’t even attempt to consider human needs as well as ecosystem / species needs.

Global estimates of % protection hide the fact that protection varies widely for different ecosystems and habitat types. Sayre et al. 2020 splits that up into 278 natural ecosystems (based on temperature, moisture, elevation, land cover, etc.). If you limit protection to IUCN 1-4 (stricter protection), 9 of those 278 were totally unprotected and 206 were below 8.5% protected (halfway to Aichi targets). If you use IUCN 1-6 (including areas allowing more human use) only 1/3 of ecosystems are below 8.5%. Table 5 shows how much of each major land cover group (forests, grasslands, etc.) has been lost, Table 4 has the details for the 278 ecosystems. Some figures are easier to see online: https://www.sciencedirect.com/science/article/pii/S2351989419307231?via%3Dihub

Waldron et al. 2020 looks at global financial implications of 30 x 30 (6 terrestrial and 5 marine scenarios), and for tropical forests & mangroves adds in avoided costs and non-monetary ecosystem service values. They estimate that expanding protected areas (PAs) to 30% could result in increased direct global revenues of $64-454 billion / yr (depending on the scenario chosen, and mostly driven by increased nature tourism, see Table 3) as well as more food and wood production. Broader economic benefits (largely from avoided storm damage) could be $170-534 billion / yr more. With a estimated cost of $103-$178 billion / yr (which includes funding to manage existing PAs), they find net economic benefits to 30x30 across all scenarios (spend some time with Table 3 to see the details, but $235 billion / yr is the lowest net financial benefit). It's hard to vet this kind of complex analysis with a ton of assumptions. My gut tells me this is a pretty optimistic assessment due to several key assumptions (like a social cost of carbon at $135-540 / t CO2e , assuming big tourism increases and scarcity of wood driving up forest product revenue, etc.). But they point out that it could be an underestimate since they didn't include broader benefits of other ecosystems like grasslands. Thoughts welcome! Note that other scientists criticized the Waldron paper, noting that not nearly enough has been done to estimate how 30x30 would affect people (nor to consult with them), among other issues. The critique (Agrawal et al. 2020) is here: https://openlettertowaldronetal.wordpress.com/

Wenzel et al. 2020 (NOAA’s 2020 MPA report) has a good overview of marine (and great lakes) protection in the U.S. 26% of US waters are in an MPA, but only 3% in a no-take zone. Page 5 of the PDF has a breakdown by region showing that some places like Alaska are disproportionately unprotected. The report also indicates MPA coverage by habitat type (e.g. 83% of mangroves are protected), calls for OECMs to improve MPA connectivity, and notes the need for better management of MPAs.


REFERENCES:

Agrawal et al. 2020. An Open Letter to the Lead Authors of ‘Protecting 30% of the Planet for Nature: Costs, Benefits and Implications.’ https://openlettertowaldronetal.wordpress.com/

Barnes, M. D., Glew, L., Wyborn, C., & Craigie, I. D. (2018). Prevent perverse outcomes from global protected area policy. Nature Ecology & Evolution, 2(5), 759–762. https://doi.org/10.1038/s41559-018-0501-y

Bhola, N., Klimmek, H., Kingston, N., Burgess, N. D., Soesbergen, A., Corrigan, C., Harrison, J., & Kok, M. T. J. (2020). Perspectives on area‐based conservation and its meaning for future biodiversity policy. Conservation Biology, 00(0), cobi.13509. https://doi.org/10.1111/cobi.13509

Devillers, R., Pressey, R. L., Grech, A., Kittinger, J. N., Edgar, G. J., Ward, T., & Watson, R. (2015). Reinventing residual reserves in the sea: are we favouring ease of establishment over need for protection? Aquatic Conservation: Marine and Freshwater Ecosystems, 25(4), 480–504. https://doi.org/10.1002/aqc.2445

Hannah, L., Roehrdanz, P. R., Marquet, P. A., Enquist, B. J., Midgley, G., Foden, W., Lovett, J. C., Corlett, R. T., Corcoran, D., Butchart, S. H. M. M., Boyle, B., Feng, X., Maitner, B., Fajardo, J., McGill, B. J., Merow, C., Morueta-Holme, N., Newman, E. A., Park, D. S., … Svenning, J. C. (2020). 30% Land Conservation and Climate Action Reduces Tropical Extinction Risk By More Than 50%. Ecography, 43(7), 943–953. https://doi.org/10.1111/ecog.05166

Jantke, K., Kuempel, C. D., McGowan, J., Chauvenet, A. L. M., & Possingham, H. P. (2019). Metrics for evaluating representation target achievement in protected area networks. Diversity and Distributions, 25(2), 170–175. https://doi.org/10.1111/ddi.12853

Jenkins, C. N., Van Houtan, K. S., Pimm, S. L., & Sexton, J. O. (2015). US protected lands mismatch biodiversity priorities. Proceedings of the National Academy of Sciences, 112(16), 5081–5086. https://doi.org/10.1073/pnas.1418034112

Mogg, S., Fastre, C., Jung, M., & Visconti, P. (2019). Targeted expansion of Protected Areas to maximise the persistence of terrestrial mammals. BioRxiv, 3056, 1–22. https://doi.org/10.1101/608992

Sayre, R., Karagulle, D., Frye, C., Boucher, T., Wolff, N. H., Breyer, S., Wright, D., Martin, M., Butler, K., Van Graafeiland, K., Touval, J., Sotomayor, L., McGowan, J., Game, E. T., & Possingham, H. (2020). An assessment of the representation of ecosystems in global protected areas using new maps of World Climate Regions and World Ecosystems. Global Ecology and Conservation, 21(December), e00860. https://doi.org/10.1016/j.gecco.2019.e00860

Simmons, B. A., Nolte, C., & McGowan, J. (2021). Delivering on Biden’s 2030 Conservation Commitment. https://www.bu.edu/gdp/2021/01/28/delivering-on-bidens-2030-conservation-commitment/

Waldron, A., Adams, V., Allan, J., Arnell, A., Asner, G., Atkinson, S., Baccini, A., Baillie, J. E., Balmford, A., Beau, J. A., Brander, L., Brondizio, E., Bruner, A., Burgess, N., Burkart, K., Butchart, S., Wenzel, L., D’Iorio, M., Wahle, C., Cid, G., Canizzo, Z., & Darr, K. (2020). Marine protected areas 2020: Building effective conservation networks. https://nmsmarineprotectedareas.blob.core.windows.net/marineprotectedareas-prod/media/docs/2020-mpa-building-effective-conservation-networks.pdf

Wenzel, L., D’Iorio, M., Wahle, C., Cid, G., Canizzo, Z., & Darr, K. (2020). Marine protected areas 2020: Building effective conservation networks. https://nmsmarineprotectedareas.blob.core.windows.net/marineprotectedareas-prod/media/docs/2020-mpa-building-effective-conservation-networks.pdf