Showing posts with label natural climate solutions. Show all posts

Thursday, May 1, 2025

May 2025 science summary

Sea lion yawning in Valdivia


Merry May,

This month I've got four articles on freshwater, plus one on whether climate mitigation can be harmful to wildlife if done wrong (spoiler: yup).

If you know someone who wants to sign up to receive these summaries, they can do so at http://bit.ly/sciencejon (no need to email me).

FRESHWATER:
Petry et al. 2025 has predictions of changing streamflow and flooding across South America by 2100 under a moderate climate change scenario. Figure 4 has the key findings about how much more or less frequent floods may be. Note that “RP” means “return period” as in a “5 year flood” or “100 year flood” (the magnitude of flooding you’d expect on that frequency / rarity, so higher numbers mean more severe flooding). RPCF means how much more or less frequent those floods would be (with negative sign indicating less frequent flooding, e.g. the -2 on the Paraguay river in the Pantanal means half as often). But much more flooding is expected in Peru, Ecuador, Colombia, and Southern Brazil, and parts of the Amazon will see 1/10 as much flooding as they historically have. They find Pantanal floods (in the Paraguay River and some tributaries like Cuiaba and Negro) will be roughly half as frequent and half as severe, they don’t have a clear trend in the Chaco, and in Chile the area from roughly Santiago to Valdivia has some rivers where flooding will be ~2-3 times less frequent while the northern part of Chile will only see slightly less flooding.

Lehner et al. 2024 is a summary of a new "Global Dam Watch (GDW)" open dataset of 41,000 river barriers and 35,000 reservoirs (see Fig 1 for a map). While national and regional datasets are more complete (e.g., NID has 90k points in the US, AMBER has 630k in Europe), this is the most comprehensive free global dataset (see Table 2) and it includes estimated reservoir volumes mostly for reservoirs >10 km2.

Cho et al. 2023 did a ton of modeling (Fig 7) to estimate how conservation (mostly reforestation along streams) could have affected the water supply of São Paulo. They found the increased habitat could serve as an "invisible reservoir" for water in soil, and in a highly idealized scenario (lots of new forest in all the right places among others) streamflow could be boosted by 33% (and drought costs reduced by 28%). They don't report numeric results for their less ideal scenarios, and all scenarios exclude the water consumption of growing trees. In a conversation with one of the study's authors, they mentioned that it likely took about 30 years (I think) for the "water savings" of nature (fog capture plus slowing down runoff during high rain events) to outweigh the water consumption of growing trees. In other words, in this case in the short term adding trees could result in lower streamflow even though in the long run it would increase streamflow. Understanding the timeline and tradeoffs is key so people who live there know what to expect. From chatting w/ other hydrologists about this, it's clear that results like this vary a lot depending on things like soil type, weather and climate, type of forest, and much more. There's an article about this one at https://www.nature.org/en-us/about-us/where-we-work/latin-america/brazil/stories-in-brazil/invisible-reservoir/

Pompeu 2025 quantitatively models how different drivers have impacted total water surface area (as a decent proxy for total flow / water quantity) in the Pantanal. The paper found the biggest driver of water level was 1) the presence or absence of having natural vegetation at least 50m around springs, followed by 2) natural veg riparian buffers along rivers (buffer width increasing w/ river width as per the Forest Code), followed by 3) replacing conventional monoculture ag w/ something w/ deeper root systems (agroforestry, permaculture, full restoration if feasible, etc.), followed by 4) preventing more dams.


CLIMATE MITIGATION AND WILDLIFE:
Smith et al. 2025 asks what the net impact of climate mitigation on land (including bioenergy crops, reforestation, and afforestation) is on the total habitat area for 14,000 vertebrate species. Fig 1 summarizes the idea well - climate change can reduce suitable habitat, but climate mitigation can also either add or remove habitat directly. Fig 4 has their global recommendations - basically leave most ecosystems alone, reforest several areas (SE Asia, Eastern US, Mexico, and much of Europe) and in a few tiny places grow bioenergy crops. In other words, typically planting trees on grasslands or other habitat types destroys more habitat than it saves through climate mitigation. But planting trees in cleared forests is a win-win.


REFERENCES:
Cho, S. J., Klemz, C., Barreto, S., Raepple, J., Bracale, H., Acosta, E. A., Rogéliz-Prada, C. A., & Ciasca, B. S. (2023). Collaborative Watershed Modeling as Stakeholder Engagement Tool for Science-Based Water Policy Assessment in São Paulo, Brazil. Water, 15(3), 401. https://doi.org/10.3390/w15030401

Lehner, B., Beames, P., Mulligan, M., Zarfl, C., De Felice, L., van Soesbergen, A., Thieme, M., Garcia de Leaniz, C., Anand, M., Belletti, B., Brauman, K. A., Januchowski-Hartley, S. R., Lyon, K., Mandle, L., Mazany-Wright, N., Messager, M. L., Pavelsky, T., Pekel, J.-F., Wang, J., … Higgins, J. (2024). The Global Dam Watch database of river barrier and reservoir information for large-scale applications. Scientific Data, 11(1), 1069. https://doi.org/10.1038/s41597-024-03752-9

Petry, I., Miranda, P. T., Paiva, R. C. D., Collischonn, W., Fan, F. M., Fagundes, H. O., Araujo, A. A., & Souza, S. (2025). Changes in Flood Magnitude and Frequency Projected for Vulnerable Regions and Major Wetlands of South America. Geophysical Research Letters, 52(5). https://doi.org/10.1029/2024GL112436

Pompeu, J. (2025). Cross-Boundary Drivers of Water Cover Reduction in the Pantanal Wetland and Implications for its Conservation. Wetlands, 45(3), 32. https://doi.org/10.1007/s13157-025-01916-w

Smith, J. R., Beaury, E. M., Cook-Patton, S. C., & Levine, J. M. (2025). Variable impacts of land-based climate mitigation on habitat area for vertebrate diversity. Science, 387(6732), 420–425. https://doi.org/10.1126/science.adm9485


Sincerely,
 
Jon

p.s. This is a sea lion lazing about in Valdivia who happened to yawn as I was watching them.

Monday, February 3, 2025

February 2025 science summary

Wetlands institute marsh

 Good day,


I have a mixture of papers as usual this week, covering using AI to do lit review (on natural climate solutions), more on seaweed to reduce cattle emissions, one on fire management, and one bad study on return-to-office mandates.

Also, I have no idea how the cost and complexity of this new AI monitoring tool (SPARROW, https://blogs.microsoft.com/on-the-issues/2024/12/18/announcing-sparrow-a-breakthrough-ai-tool-to-measure-and-protect-earths-biodiversity-in-the-most-remote-places/) compares to simpler camera trap setups but I’m especially curious if the acoustic component might be able to detect amphibians or birds unlikely to be visible in a camera trap (thanks to Tara Schnaible for passing this on). If any of you are using camera traps and/or microphones for biomonitoring I'd love to hear your thoughts!

If you know someone who wants to sign up to receive these summaries, they can do so at http://bit.ly/sciencejon (no need to email me).


CLIMATE CHANGE AND AI METHODS:
Chang et al., 2024 uses specialized large language models to assess evidence for 11 co-impacts (positive or negative) of natural climate solutions (NCS). They extracted data from 257,266 studies (after screening 2.3 million)! Most (87%) focused on management, ~30% covered protection and/or restoration, but <2% mentioned cost or equity or Indigenous peoples or local communities. Fig 2 has a nice breakdown of NCS pathways, biome, co-impacts, etc., and Fig 4b maps countries by both evidence and mitigation potential. Paraguay and Republic of the Congo pop as highest carbon w/ lowest evidence (needing research), while the Americas and E/SE Asia have high evidence and high carbon (needing implementation). Fig 3 shows the volume of evidence for how 22 NCS pathways intersect with the 11 co-impacts (9 of which relate to human well-being). They argue that West and Central Africa deserves special research attention as evidence and human development index are relatively low while NCS potential and threatened species are high. One key caveat: evidence volume does not mean evidence quality. For example, there are many papers on sowing legumes in pasture to reduce enteric methane, but I'm not aware of any that are both accurate and precise enough for implementation (since putting them in the wrong places would lead to increased emissions). But this is still a great example of using AI to review a much larger body of evidence than would be possible manually.


CATTLE AND CLIMATE CHANGE:
Meo-Filho et al. 2024 is an important study (part of a special issue of papers around the sustainability of animal foods and plant alternatives, https://www.pnas.org/topic/561). There's been lots of research with hyperbolic claims about red algae reducing methane production in cattle (mostly in vitro, or tests in a petri dish). I believe this is the first paper to measure methane reductions not only 1) in vivo (a test of what happens in real animals) but 2) in the grazing phase of their life cycle. Most American cattle graze for very roughly 15 months before spending 3 months in a feedlot, and they emit more methane per day when grazing. Only 15% of total cattle production GHGs come from the feedlot phase, so even big reductions then can't touch cattle's high carbon footprint. But this paper found supplementing with the seaweed reduced GHGs relative to control animals by 38% over 90 days with no side effects! That is great news and this is work worth following up, BUT a few key caveats: 1) this was a study of only 24 animals, 2) the animals began at 15 months when they would typically go to a feedlot, to show how much this could really reduce the total carbon footprint of cattle (and if any side effects crop up eventually) it would need to be tested on calves from when they are weaned off of milk to when they go to slaughter, and 3) variations in cattle breed, the dominant type of grass they're eating, and climate could all affect the results. So it's very good news, but does not yet mean it's possible to produce a burger w/ 1/3 less carbon. Also, while the numbers are hotly contested, remember that the carbon footprint of beef is very roughly 10* that of pork or chicken (~50* the GHG of beans), so even if the reduction IS scalable, beef will still be a high carbon food.

Cowley et al. 2024 is a paper with very exiting results about reducing the carbon footprint of beef. They fed Australian Angus cows in a feedlot red seaweed (Asparagopsis) infused into vegetable oil, and added it to their diet at three concentrations of CHBr3 from the sewaweed, plus a control w/ no seaweed (5 cows for each of the four treatments). The medium and high doses reduced enteric methane (CH4) by 98% and 99%, with no significant reported side effects. Other studies have seen less impressive reductions in live cattle (e.g. George et al. 2024 found ~50% reduction), although in petri dishes 99% reductions have been achieved before. The discussion covers potential factors influencing the CH4 reduction, including dose, how much of the feedlot diet is grain vs grass, and cattle breed. Caveat - one high dose cow (20% of the sample) got acidosis and had to be removed, all groups had some health problems, and the medium and high doses did increase neutrophil and platelet count. Overall - at medium and high doses the methane was almost eliminated without affecting meat taste or safety, and without clear cattle health impacts. So the study is very promising, but needs to be replicated with larger groups and different contexts (including eventually a study using Asparagopsis during both the entire grazing phase and feedlot phase).


FIRE MANAGEMENT:
Lacey et al. 2024 highlights opportunities for prescribed fire and/or thinning (removing trees and/or brush) to proactively reduce risk for vulnerable communities and areas of high ecological value. Socially vulnerable communities are less likely to get this preventive fire management, but the authors find there are "win-win" opportunities for places high in: ecological value (specifically biodiversity, connectivity, and climate resilience), ecosystem services (carbon and drinking water), social vulnerability (see Table 1 for indicators), and the potential for wildfire mitigation to be effective (the last is based on fire hazard and vegetative cover). Fig 2c has their top priority areas, including big chunks in the Appalachians, Ozarks, and Rocky Mountains (esp. CO and ID), and Fig 4 shows in yellow where those overlap with the USFS top 10 firesheds. Fig 3 shows how much better their priority areas perform against several indicators than a focus solely in fire mitigation potential; as you'd expect optimizing for social vulnerability, ecosystem services, and ecological value results in sites that score a lot better on those indicators! That may seem obvious, but to reframe: in conservation we OFTEN don't include certain objectives in our planning but still expect to have great stories about all the co-benefits we got anyway. This paper is a great pitch for the value of inclusion; planning for what you care about up front will help you focus work on the places where you can have the most impact.


RETURN TO OFFICE MANDATES:
I already put this on LinkedIn but also wanted to flag here that I thought the recent Ding & Ma 2024 study from University of Pittsburgh (which has had a lot of media attention w/o scrutiny) was misleading. They found that 1) return to office mandates don't improve employee or company performance and 2) these mandates are used more to blame employees and "grab power" than to try and improve performance. This doesn't appear to be peer-reviewed research, which makes me more skeptical by default (it could still be right, but there's no screen for bad methods or misleading results). The paper's tone and methods make it look like they set out to prove some preconceived notions rather than exploring what's going on with an open mind, and the way they assert attribution and causation to some findings they report appear unsupported by the data. Their interpretations of their data are plausible, but even if you trust the data there are other valid interpretations which are also plausible. 

The reason I posted this despite it seeming like a "bad" study is to flag the role of bias in reading science. I believe that if I was required to go to the office more often, it would negatively impact my performance and happiness. I can point to personal experience backing that up (I'm more willing to work longer hours when I don't have a commute or when I'm getting hungry but don't have food nearby to keep working). But in situations like this where I have an opinion and feel inclined to "right on!" what I read, that's exactly when I need to slow down and read carefully since I know I have bias leading me to accept certain results and interpretations as convincing. Also - read a news article about science and wondering if it's misleading? I generally first look for the press release from the host institution (to read a summary that the authors would have had a chance to review to reduce accidental misunderstanding, although they are still unreliable whether on accident or on purpose to hype it: https://business.pitt.edu/return-to-office-mandates-dont-improve-employee-or-company-performance/ ), then read the actual paper.

Don't assume the press release, or even my summary is accurate! Always check before you share or act on a research summary.


REFERENCES:
Chang, C. H., Erbaugh, J. T., Fajardo, P., Lu, L., Molnár, I., Papp, D., Robinson, B. E., Austin, K. G., Castro, M., Cheng, S. H., Cook-Patton, S., Ellis, P. W., Garg, T., Hochard, J. P., Kroeger, T., McDonald, R. I., Poor, E. E., Smart, L. S., Tilman, A. R., … Masuda, Y. J. (2024). Global evidence of human well-being and biodiversity impacts of natural climate solutions. Nature Sustainability. https://doi.org/10.1038/s41893-024-01454-z

Cowley, F. C., Kinley, R. D., Mackenzie, S. L., Fortes, M. R. S., Palmieri, C., Simanungkalit, G., Almeida, A. K., & Roque, B. M. (2024). Bioactive metabolites of Asparagopsis stabilized in canola oil completely suppress methane emissions in beef cattle fed a feedlot diet. Journal of Animal Science, 102(April). https://doi.org/10.1093/jas/skae109

Ding, Y., & Ma, M. (Shuai). (2024). Return-to-Office Mandates. In S&P Global Market Intelligence. https://doi.org/10.2139/ssrn.4675401

Lacey, L. M., Suraci, J. P., Littlefield, C. E., Busse, B. S., & Dickson, B. G. (2024). Informing proactive wildfire management that benefits vulnerable communities and ecological values. People and Nature, August, 1–15. https://doi.org/10.1002/pan3.10733

Meo-Filho, P., Ramirez-Agudelo, J. F., & Kebreab, E. (2024). Mitigating methane emissions in grazing beef cattle with a seaweed-based feed additive: Implications for climate-smart agriculture. Proceedings of the National Academy of Sciences, 121(50), 2–9. https://doi.org/10.1073/pnas.2410863121


Sincerely,
 
Jon
 
p.s. the photo is of a salt marsh at The Wetlands Institute in Stone Harbor, NJ

Monday, October 3, 2022

October 2022 science summary

Calli & Jon on porch

Greetings,


This month I am summarizing two science articles on climate change and one on conservation prioritization

If you know someone who wants to sign up to receive these summaries, they can do so at http://bit.ly/sciencejon (no need to email me).

CONSERVATION PRIORITIES:
Belote et al. 2021 is a great analysis comparing how different ways of identifying spatial conservation priorities overlap and conflict in the lower 48 states of the US. They focus on 4 groups of vertebrates (mammals, birds, amphibians, and reptiles), and 4 methods of prioritizing: species richness, rarity-weighted richness, and two Zonation approaches that favor complementarity / representation (ABF favors species richness, CAZ favors rarity). Fig 1 has the most interesting maps if you want to compare the approaches, and Fig 3 highlights the places with the most agreement across models that they are in the top 30% of options. It's a great way to see how your values and methods can affect your results (but also that some places are pretty agreed on priorities). Two things to contrast with the NatureServe "map of biodiversity importacet" - that analysis includes plants and some invertebrates (this does not), and NatureServe focuses on imperiled species while this is threat-blind. One last note on the zonation approaches - these work best as a complete set; if you pick and choose among them they don't perform nearly as well, and it's rare that science recommendations are ever taken up entirely. But conversely a focus solely on richness or rarity misses lower diversity ecosystems and wide-ranging species.


CLIMATE CHANGE:
Temmink et al. 2022 is an overview of carbon storage and cycling in wetlands. They note peatlands and coastal wetlands have much higher carbon stock density than forests or oceans, and also sequester more carbon each year (see the figure in the Review Summary for a nice overview, or Fig 1 for more detail). They also focus on how healthy wetlands have feedbacks that support high productivity and/or low decomposition (see Fig 2), but that people are disrupting those feedbacks. They show how much of these ecosystems have been lost already, and how fast they are disappearing (Table 1) and estimate this amoutns to 500 million metric tons of C lost each year. They closeby arguing that keeping wetlands intact is key for climate mitigation. One caution though - they focus only on carbon, and some wetlands emit quite a lot of methane and nitrous oxide. Those are much stronger GHGs than CO2, so the net climate benefit of wetlands is smaller than you'd think from looking at carbon alone.

Law et al. 2018 is an analysis of how more trees in Oregon (planting, cutting less often, and halting cutting) can lead to more climate mitigation benefits and cobenefits of water availability (maybe, stay tuned on that). From 2011-2015, OR forests already on net sequestered the equivalent of 72% of OR's total GHGs (Fig 2), and they think that could be boosted by 56% with a series of programs. See Figure 3 for this potential, but note the bars each represent a single decade (and the lower figure is annual change within that decade), with cumulative results from 2015-2100 showing up as numbers in italics OVER the bars. This confused me pretty thoroughly, and it looks to me from the Figure like annual "net ecosystem carbon balance" (~=net carbon sequestered) by 2100 would increase by ~1.2 Tg C / yr, not the 2-3 they say in the text. They also find that using harvest residues for bioenergy would lead to a net increase in emissions (even assuming 1/2 of residues replace coal or natural gas). One thing that struck me as very odd: they propose afforesting grass crops which are irrigated but not used for food or forage, and claiming water will be freed up by doing so. But I can't figure why someone would irrigate grass if it wasn't used for food (or things like lawns or golf courses which forests wouldn't be compatible with)- maybe it's literally fields to produce grass seed sold for lawns?
Peter Ellis from TNC had this take which I found helpful (that this shouldn't be taken as having national implications): "The study is constrained to the Pacific Northwest (PNW). If you care about carbon, you can never really beat leaving a PNW forest alone. No attempts to sell the idea of mitigation through bioenergy or wood product storage are going to beat carbon storage in forests in a region where: 
•    Trees are largest in the world
•    They take forever to decompose, so coarse woody debris storage is really important.
Their proposal for Oregon’s forest actually makes a lot of sense to me: 'reforestation, afforestation, lengthened harvest cycles on private lands, and restricting harvest on public lands increased net ecosystem carbon balance by 56% by 2100'"

REFERENCES:

Belote, R. T., Barnett, K., Dietz, M. S., Burkle, L., Jenkins, C. N., Dreiss, L., Aycrigg, J. L., & Aplet, G. H. (2021). Options for prioritizing sites for biodiversity conservation with implications for “30 by 30.” Biological Conservation, 264, 109378. https://doi.org/10.1016/j.biocon.2021.109378

Law, B. E., Hudiburg, T. W., Berner, L. T., Kent, J. J., Buotte, P. C., & Harmon, M. E. (2018). Land use strategies to mitigate climate change in carbon dense temperate forests. Proceedings of the National Academy of Sciences, 115(14), 3663–3668. https://doi.org/10.1073/pnas.1720064115

Temmink, R. J. M., Lamers, L. P. M., Angelini, C., Bouma, T. J., Fritz, C., van de Koppel, J., Lexmond, R., Rietkerk, M., Silliman, B. R., Joosten, H., & van der Heide, T. (2022). Recovering wetland biogeomorphic feedbacks to restore the world’s biotic carbon hotspots. Science, 376(6593). https://doi.org/10.1126/science.abn1479


Sincerely,
 
Jon
 
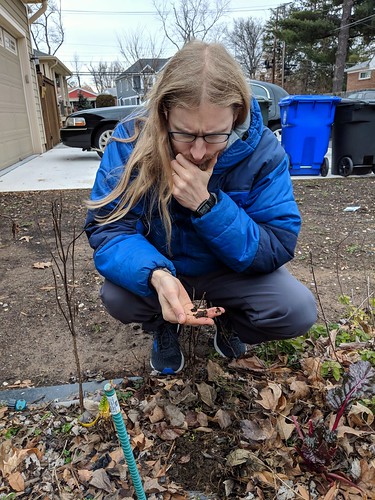
p.s. This is a recent picture of me and my neighbor's adorable snaggletoothed dog Calli on our porch (we were dogsitting).

Wednesday, September 1, 2021

September 2021 science summary

Climate emission curves

Greetings,

This month is all about climate change (the photo above is from mini golf course in Brooklyn, where the three paths represent emissions scenarios).

First - I want to clarify something from last month's update. I mentioned that big old trees are especially important for carbon sequestration, and that increasing the length of time between forests being logged and/or leaving the biggest trees can be helpful to retain that carbon. But the term "proforestation" that I used is apparently commonly used to mean no forest management at all. That means eliminating any tree cutting at all (not just commercially, but even for pest management, fire control, or ecological goals). While logging can have environmental downsides (including for carbon), wood products are also relatively sustainable, and cutting trees is one of several important forest management tools that may be useful even in lands managed primarily for conservation. In cases where not cutting trees increases the risk of severe fire, that could even lead to worse outcomes for carbon sequestration and storage. Apologies for the poor choice of language.

If you know someone who wants to sign up to receive these summaries, they can do so at http://bit.ly/sciencejon

CLIMATE CHANGE:
You probably have heard that the 2021 IPCC report came out this month: https://www.ipcc.ch/report/ar6/wg1/ Don't feel like reading 1800 pages or even the 90 page summary or 215 page FAQ? Check out the 2 page 'headline statements' here:  https://www.ipcc.ch/report/ar6/wg1/downloads/report/IPCC_AR6_WGI_Headline_Statements.pdf
The one thing to highlight for me is that limiting warming to 1.5C is now harder but not impossible (requiring net zero by 2055 w/ 90% gross emissions reductions). Current policies agreed to under Paris would still lead to 3C warming by 2100. One finding that I read about in this New York Times article (https://www.nytimes.com/2021/08/09/climate/climate-change-report-ipcc-un.html) really struck me: a bad heat wave that used to happen every ~50 years is now happening every ~10 years, and will happen every ~5 years at 1.5C or nearly annually at 4C. Don't miss this interactive tool to explore the results (and note you can download spatial data via the "share" icon): https://interactive-atlas.ipcc.ch/

Want some good news about climate? Costa et al. 2021 have a brief overview of the use of GWP* as a way to calculate the global warming potential of methane (CH4) more accurately than GWP100 (100 year warming). This is super-tricky and took me a while to wrap my head around, but the basic issue is that because methane is naturally breaking down over time, GWP* looks at emissions 20 years ago (which are now breaking down into CO2) to understand net changes in CH4 (as opposed to GWP100 which treats it as constant over 100 years). It means that relatively small reductions in biogenic methane (mostly from livestock and soil) emissions could get us to a stable point where globally methane is emitted and broken down at the same rate. Since the CO2 that feeds into biogenic CH4 is pulled out of the atmosphere via feed, that means it's arguably easier than we thought earlier to get to the point where globally biogenic methane isn't causing warming. Two big caveats: 1) this doesn't apply to fossil methane (where the end product of CO2 is pulled out of the ground, leading to a net increase), 2) this only makes sense when estimating global methane levels, and NOT in thinking about reductions at a local level. The latter point is important - a company or country could use this metric to make small reductions in livestock emissions and "take credit" for the breakdown of high past levels, and argue they are carbon negative (they are not). But if you take away the attribution issue, and focus on estimating warming, this offers an improvement. Let me know if this is still confusing to you, and/or you think I got this wrong!

Green et al. 2019 quantify the well known issue of climate and soil moisture having a big impact on carbon sequestration. Using climate projections (now out of date w/ the 2021 IPCC report) they find that as climate gets more variable, carbon sequestration and storage by plants will strongly decline (offsetting CO2 fertilization by 2060 under conservative assumptions). By 2085 carbon sequestration will have fallen to half of what it would have been without the moisture variability. The potential  carbon lost through drought and fire exceeds potential carbon gains from unusually wet conditions. This is mostly b/c plants get a lot less productive under drought, while too much water doesn't spur lots of growth (and can even be harmful with floods). Surprisingly they focused on plant biomass rather than modeling soil carbon changes, nor did they look at the impact of this changing soil moisture on methane or nitrous oxide soil emissions. There's a summary of this paper at https://www.carbonbrief.org/climate-changes-impact-on-soil-moisture-could-push-land-past-tipping-point

Fox et al. 2018 looked at how common parasites in lambs impact methane production. I was intrigued by the title (which says they drive a 33% increase in 'methane yield') which seemed to indicate a huge potential to reduce GHGs from lamb through medical treatment. But that is a fairly artificial metric of methane emissions per mass of feed. A more meaningful metric is total methane emissions (fig 2), which were highest in healthy lambs eating a normal diet, moderately lower in parasitized lambs, and slightly lower than that in healthy lambs eating less to control for the weight loss impact of parasites. Usually the main metric is emissions per kg of meat; I estimated this from final body weight using table 1 and figure 2 and it looks like healthy lambs emitted ~1.83 daily g CH4 / kg final body weight, parasitized lambs emitted ~1.67 daily g CH4 / kg final body weight, and healthy lambs on a restricted diet emitted ~1.62 daily g CH4 / kg final body weight. My take away from this paper is that eliminating parasites is unlikely to deliver much climate mitigation (in this case without dietary adjustment would INCREASE GHGs), although it may be desirable from an animal welfare or efficiency perspective.

REFERENCES:

Costa Jr, C., Wironen, M., Racette, K., & Wollenberg, E. (2021). Global Warming Potential* (GWP*): Understanding the implications for mitigating methane emissions in agriculture. CCAFS Info Note. Wageningen, The Netherlands https://cgspace.cgiar.org/handle/10568/114632

Fox, N. J., Smith, L. A., Houdijk, J. G. M., Athanasiadou, S., & Hutchings, M. R. (2018). Ubiquitous parasites drive a 33% increase in methane yield from livestock. International Journal for Parasitology, 48(13), 1017–1021. https://doi.org/10.1016/j.ijpara.2018.06.001

Green, J. K., Seneviratne, S. I., Berg, A. M., Findell, K. L., Hagemann, S., Lawrence, D. M., & Gentine, P. (2019). Large influence of soil moisture on long-term terrestrial carbon uptake. Nature, 565(7740), 476–479. https://doi.org/10.1038/s41586-018-0848-x

IPCC, 2021: Climate Change 2021: The Physical Science Basis. Contribution of Working Group I to the Sixth Assessment Report of the Intergovernmental Panel on Climate Change [Masson-Delmotte, V., P. Zhai, A. Pirani, S. L. Connors, C. Péan, S. Berger, N. Caud, Y. Chen, L. Goldfarb, M. I. Gomis, M. Huang, K. Leitzell, E. Lonnoy, J. B. R. Matthews, T. K. Maycock, T. Waterfield, O. Yelekçi, R. Yu and B. Zhou (eds.)]. Cambridge University Press. In Press. https://www.ipcc.ch/report/ar6/wg1/

Sincerely,
 
Jon
 
p.s. Here's one more picture from the climate change mini golf course, showing a polar bear on melting ice floes 

Tuesday, June 1, 2021

June 2021 science summary

Come play with me


Hi,

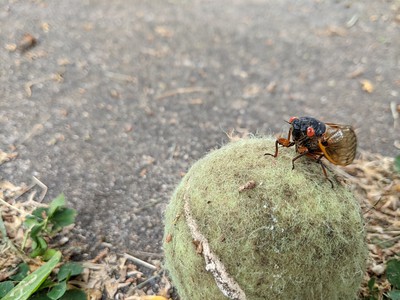
Hope cicadas or other issues aren't keeping you from getting back into the world as people get vaccinated and cases are going down (in most places at least). The cicada above is super fun and ready to play!

This month I am focusing on climate change and biodiversity articles.

If you know someone who wants to sign up to receive these summaries, they can do so at http://bit.ly/sciencejon


BIODIVERSITY:

Ellis et al. 2021 argue that protecting untouched or unmodified habitat from people is a fundamentally flawed framing, b/c most habitat on earth has been to some degree inhabitated by (and modified by) people for thousands of years). It's a good point that what we consider 'natural' is subjective and arbitrary (e.g. the grasslands of the Midwestern U.S. are a result of thousands of years of intentionally set fires and other impacts by indigenous people), and modified ecosystems may have higher species richness or other metrics. They have great data on how much habitats and land use have changed over time (check out all the figures for that), and make an excellent case about how wrong it is to depict human use of nature as a recent despoiling of human-free places. They further argue that current biodiversity losses come from "the appropriation, colonization, and intensifying use of the biodiverse cultural landscapes long shaped and sustained by prior societies" and that the solution lies in empowering the stewardship of indigenous people and local communities. I agree that opinions about which kind of ecosystem and land use is "good" are subjective, that there are good social and human rights reasons to support local autonomy, and that typically local and indigenous people use natural areas in a way more compatible with biodiversity than how people from elsewhere tend to. I think it's also worth recognizing that even indigenous people have consistently caused some extinctions (of large mammals in particular) when they first arrived to actually uninhabitated ecosystems, and that in some cases they currently support the same kind of intensification associated with colonialism. So local autonomy will not always be a recipe for maintaining ecosystems more or less as they currently are, although there are plenty of valid opinions about which human and ecosystem outcomes conservation organizations should work to support. I'd definitely recommend reading the paper, and I realize I have a lot of listening and learning to do on the subject of indigenous-led conservation.

Blankenship et al. 2021 is a good overview of the best available data for historical vegetation / land cover in the U.S. (which comes from LANDFIRE's Biophysical Setting [BpS] model), and how it was produced. It estimates habitat prior to European settlement of the Americas (but not prior to the arrival of Native Americans so not free of human influence). A LOT of data and expertise went into this, including expected natural succession of diferent ecosystems after disturbance, estimated fire frequency and severity, and more. I've used it to identify which areas are appropriate to reforest and which weren't forested to begin with (so shouldn't be a target of restoration in most cases). One bonus aspect of these data is that the team who manages them are incredibly helpful and willing to provide advice and guidance on how to apply them. There is a lot of helpful detail, caveats, and next steps in here for people who may want to use these data.


CLIMATE CHANGE:

Evans et al. 2021 estimated how to reduce greenhouse gases (GHGs) by raising water levels in peatlands which have been drained for agriculture. They found raising the water table by 10cm (re-wetting the peat) reduces net greenhouse gases (GHGs) by an average of 3 t CO2e/yr until it rises to a depth 30cm, from 30cm-8cm rising methane results in smaller net GHG benefits, and <8cm GHGs become net positive (see Fig 1). Cutting the water table depth in half globally (raising it to an average of 45cm in croplands and 25cm in grasslands) would cut emissions from drained peat by about 2/3 (from 786 Mt [aka MMT] CO2e/yr to 278 MT CO2e/yr). These are conservative estimates (leaving out N2O and reduced emissions from avoided deep fires), although the range of those estimates is huge (see Table 1). Alternatively re-wetting all peat up to 10cm would eliminate almost all peat emissions and likely even drive them slightly negative (15 Mt CO2e/yr). However, cutting water table depth in half would flood part of the root zone for most crops and regions, which would reduce yield. But raising the water table to just below the root zone could have big GHG benefits and potentially even improve crop resilience to drought. This is a big opportunity!

Lenzen et al. 2018 estimate the global carbon footprint of tourism in 2013, and is a fascinating read but looks to me like it has some big errors. They find tourism is 8% of global emissions (much higher than other estimates, b/c they look at full supply chain emissions, which means this 8% cuts across several sectors). They helpfully summarize the results both by the countries where tourists reside, and the countries they visit (see Fig 1 and take a moment to read what it all means as it's fascinating). But some of their findings don't make sense to me. For example, they report that from 2009-2013 tourism spending went up by 88% while emissions only rose 15% (which seems very odd, and Fig SI2 on p21 of the supplement looks like spending only went up ~28%). Also, Fig 1 reports Canada as the top "net origin" by emissions but in Table 1 it seems like a huge net destination (with US travel to Canada by far the biggest flow globally). If anyone knows the paper and can point out if I'm missing something I'd appreciate it, otherwise this looks entertaining but unreliable.

Lipsett-Moore et al. 2018 finds that improved fire management in savannas could reduce a lot of greenhouse gas (GHG) emissions, especially in Africa (which has 77% of global potential, compared to 15% in South America and 8% in Austraila & PNG). The basic idea was piloted in Australia, and involves intentional burning in the early dry season to reduce fire (intensity, frequency, and scale) later on. The pilot roughly tripled the area burned early, while cutting the area burned late by 2/3, resulting in ~1/3 less GHG emissions over 7 years. This analysis uses remote sensing to estimate fire emissions and opportunities to reduce them. In South America the total emissions potential is much lower than Africa, but the relative change is larger (75% reduction). These changes count under Kyoto so can be used for carbon credits.

Milly and Dunne 2020 predict a roughly 9% decrease in flow in the Colorado River for every degree C increase in local temperature, due to evaporation increasing more than precipitation. Much of the paper is about different aspects of the model and how they corrected for some issues, but the core point that areas expecting more rain may still see rivers dry out was notable (especially in areas where snow cover is expected to decrease).


REFERENCES:

Blankenship, K., Swaty, R., Hall, K. R., Hagen, S., Pohl, K., Shlisky Hunt, A., Patton, J., Frid, L., & Smith, J. (2021). Vegetation dynamics models: a comprehensive set for natural resource assessment and planning in the United States. Ecosphere, 12(4). https://doi.org/10.1002/ecs2.3484

Ellis, E. C., Gauthier, N., Klein Goldewijk, K., Bliege Bird, R., Boivin, N., Díaz, S., Fuller, D. Q., Gill, J. L., Kaplan, J. O., Kingston, N., Locke, H., McMichael, C. N. H., Ranco, D., Rick, T. C., Shaw, M. R., Stephens, L., Svenning, J.-C., & Watson, J. E. M. (2021). People have shaped most of terrestrial nature for at least 12,000 years. Proceedings of the National Academy of Sciences, 118(17), e2023483118. https://doi.org/10.1073/pnas.2023483118

Evans, C. D., Peacock, M., Baird, A. J., Artz, R. R. E., Burden, A., Callaghan, N., Chapman, P. J., Cooper, H. M., Coyle, M., Craig, E., Cumming, A., Dixon, S., Gauci, V., Grayson, R. P., Helfter, C., Heppell, C. M., Holden, J., Jones, D. L., Kaduk, J., … Morrison, R. (2021). Overriding water table control on managed peatland greenhouse gas emissions. Nature. https://doi.org/10.1038/s41586-021-03523-1

Lenzen, M., Sun, Y.-Y., Faturay, F., Ting, Y.-P., Geschke, A., & Malik, A. (2018). The carbon footprint of global tourism. Nature Climate Change, 8(6), 522–528. https://doi.org/10.1038/s41558-018-0141-x

Lipsett-Moore, G. J., Wolff, N. H., & Game, E. T. (2018). Emissions mitigation opportunities for savanna countries from early dry season fire management. Nature Communications, 9(1), 2247. https://doi.org/10.1038/s41467-018-04687-7

Milly, P. C. D., & Dunne, K. A. (2020). Colorado River flow dwindles as warming-driven loss of reflective snow energizes evaporation. Science, 367(6483), 1252–1255. https://doi.org/10.1126/science.aay9187


Sincerely,


Jon

Monday, November 11, 2019

Soil carbon - what is it good for?

A while back I was on a soil carbon working group with the Science for Nature and People Partnership (SNAPP). Our recent journal article is about soil carbon and soil health. It’s a good read, and only 1,800 words: https://www.nature.com/articles/s41893-019-0431-y or https://rdcu.be/bWGfa if you don't have access.

Pondering soil health

The lead author did a phenomenal job getting the text to be clear and succinct, and the opening two lines actually sum it up very well:
"Soil-based initiatives to mitigate climate change and restore soil fertility both rely on rebuilding soil organic carbon. Controversy about the role soils might play in climate change mitigation is, consequently, undermining actions to restore soils for improved agricultural and environmental outcomes."

In other words: scientists disagree about how effective soil carbon is as a climate change mitigation strategy. We disagree a lot - more than you'd expect. Everything from "this is our best bet to start scaling up now" to "building soil carbon will not result in any net climate mitigation." So we argue about it a lot.

But that debate hides the fact that we generally strongly agree that rebuilding soil carbon is good for farmers and ranchers. Most agricultural soils have lost carbon over time. Regaining it can mean less erosion, better water retention, and better crop resilience to stress. With good management it can even mean less fertilizer use and cleaner water. How much carbon is ideal in different landscapes, and how to best increase it, varies. But it's worth remembering how strong the consensus is on the value of building soil carbon from an agricultural perspective.

Read the paper here: Soil carbon science for policy and practice
There's also a press release here: Building A ‘Solution Space’ for Soil

Monday, November 4, 2019

November 2019 Science Journal Article Summary

Spider at Bodie lighthouse
Happy (belated) Halloween!

This month I'm focused on landscape ecology and climate change (yet again), and unfortunately not spiders or other spooky topics. I also have a webinar on research impact to plug, and a new paper out on the adoption of new practices. As always people can sign up for this newsletter at http://bit.ly/sciencejon

Are you a scientist who produces research that you want to have real-world impact? If so, I'll be hosting a session on December 3 (1p EST) with a series of recommendations from a paper that I have in review. You can learn more and register here: https://zoom.us/webinar/register/WN_Q78ubqH9TL6tkmLQCRyAsw and can read the draft paper at http://bit.ly/strongerscience


ORGANIZATIONAL LEARNING / BEHAVIOR CHANGE:
Reddy et al. 2019 (I'm a co-author) looked at the adoption of a new conservation planning framework (Conservation by Design 2.0) being rolled out by The Nature Conservancy. Some staff & teams were early adopters, but it was slow to spread. But people who worked on projects with early adopters from different teams were more likely to use the new practices. Having early adopters work with people from different teams who are slower to change can speed exposure to new ideas and help everyone to learn and adapt. Supervisors should encourage talent-sharing and learning exchanges so this happens more.


LANDSCAPE ECOLOGY:
Sawyer et al. 2019 looks at how which route animals take during migration impacts their survival. Their key finding was that both their choice of destination ("summer range") and how to get there had a big impact on survival. They found 'exterior' routes (near the edge of the migration corridor) had 30% lower survival compared to interior routes. However - look close at Figure 3 (red means high mortality risk, green low, blue medium). It appears to me that their finding may be an artifact of the fact that mortality is driven by specific destinations, and they didn't report this b/c of how they aggregated summer range boundaries. So it's unclear whether the risk comes from where they go or how they get there.

Tucker et al. 2018 uses GPS data from ~800 animals from 57 mammal species around the world (see Fig 1 for locations) to assess how animals move differently depending on how much humans have modified the landscape (e.g. through buildings, farms, lights, transit, etc.). Unsurprisingly they found more modified areas resulted in significantly less animal movement - especially over time periods of a day or more. They also compared species and confirmed that predators and larger animals tended to move farther, as did animals in resource-poor areas. No big shocks here, but an interesting read.

Tambosi et al. 2014 presents a method to identify priority areas that are highly likely to improve the ecological resilience of a landscape. They look for areas with intermediate resilience - meaning they have decent amounts of habitat and connectivity already, and through targeted restoration they could better connect more intact areas. They then apply this method to the Atlantic Forest in Brazil to identify ~15 million ha of priority areas to reforest (they don't report which subset of that is high vs low priority). It's a relatively simply graph theory approach to connectivity.


CLIMATE CHANGE:
Betts 2000 has a point that should be better known. He found boreal forests' ability to mitigate climate change is weak (and may even be negative). Dark needles (present year round) absorb a lot more infrared radiation than typically snow-covered ground. This reduction in albedo (diffuse reflectivity) reduces and in some cases outweighs the carbon sequestration. He compared forest to cropland, but didn't account for N2O emissions from fertilizer.

Li et al. 2015 compares the net impact of different kinds of forests on local weather, considering albedo and evapotranspiration. Their key finding is that "tropical forests have a strong cooling effect throughout the year; temperate forests show moderate cooling in summer and moderate warming in winter with net cooling annually; and boreal forests have strong warming in winter and moderate cooling in summer with net warming annually." This means that the net climatic effect (accounting for carbon sequestration as well as local weather) of tropical forests (and to a lesser extent, temperate forests) is stronger than indicated by carbon alone, while for boreal forests the carbon benefit is significantly offset.

Minx et al. 2018 is an overview from a 3-part series on negative emissions (which they define as reforestation, soil carbon, biochar, BECCS, DACCS, enhanced weathering & ocean alkalinization, and ocean fertilization). Table 2 summarizes potential impact and costs from various studies, and Fig 6 has a great visual synthesis of these data. They find afforestation, reforestation, and soil carbon as ready for large-scale deployment (albeit reversible), and all but ocean fertilization as having potential to deliver benefits by 2050. There are lots of other good insights here and it's worth reading.

Fuss et al. 2018 is a look at costs, potential, & side effects from a 3-part series on negative emissions (which they define as reforestation & afforestation, soil carbon, biochar, BECCS, DACCS, enhanced weathering & ocean alkalinization, and ocean fertilization). It has good details for each negative emissions option, but the most useful part for me was Figure 2, which shows the relative contribution needed from 'conventional abatement' (e.g. reducing fossil fuel emissions via clean energy & efficiency, and reducing land use change) vs 'negative emissions' over time.


REFERENCES:
Betts RA. 2000. Offset of the potential carbon sink from boreal forestation by decreases in surface albedo. Nature 408: 187–190.

Fuss S, Lamb WF, Callaghan MW, Hilaire J, Creutzig F, Amann T, Beringer T, Garcia W de O, Hartmann J, Khanna T, Luderer G, Nemet GF, Rogelj J, Smith P, Vicente JLV, Wilcox J, Dominguez M del MZ, Minx JC. 2018. Negative emissions — Part 2 : Costs , potentials and side effects. Environmental Research Letters 13: 063002.

Li Y, Zhao M, Motesharrei S, Mu Q, Kalnay E, Li S. 2015. Local cooling and warming effects of forests based on satellite observations. Nature Communications 6: 1–8.

Minx JC, Lamb WF, Callaghan MW, Fuss S, Hilaire J, Creutzig F, Amann T, Beringer T, De Oliveira Garcia W, Hartmann J, Khanna T, Lenzi D, Luderer G, Nemet GF, Rogelj J, Smith P, Vicente Vicente JL, Wilcox J, Del Mar Zamora Dominguez M. 2018. Negative emissions - Part 1: Research landscape and synthesis. Environmental Research Letters 13

Reddy SMW, Torphy K, Liu Y, Chen T, Masuda YJ, Fisher JRB, Galey S, Burford K, Frank KA, Montambault JR. 2019. How different forms of social capital created through project team assignments influence employee adoption of sustainability practices. Organization & Environment .

Sawyer H, LeBeau CW, McDonald TL, Xu W, Middleton AD. 2019. All routes are not created equal: An ungulate’s choice of migration route can influence its survival. Journal of Applied Ecology 1–10.

Tambosi LR, Martensen AC, Ribeiro MC, Metzger JP. 2014. A framework to optimize biodiversity restoration efforts based on habitat amount and landscape connectivity. Restoration Ecology 22: 169–177.

Tucker MA, Böhning-Gaese K, Fagan WF, Fryxell JM, Van Moorter B, Alberts SC, Ali AH, Allen AM, Attias N, Avgar T, Bartlam-Brooks H, Bayarbaatar B, Belant JL, Bertassoni A, Beyer D, Bidner L, van Beest FM, Blake S, Blaum N, Bracis C, Brown D, de Bruyn PJN, Cagnacci F, Calabrese JM, Camilo-Alves C, Chamaillé-Jammes S, Chiaradia A, Davidson SC, Dennis T, DeStefano S, Diefenbach D, Douglas-Hamilton I, Fennessy J, Fichtel C, Fiedler W, Fischer C, Fischhoff I, Fleming CH, Ford AT, Fritz SA, Gehr B, Goheen JR, Gurarie E, Hebblewhite M, Heurich M, Hewison AJM, Hof C, Hurme E, Isbell LA, Janssen R, Jeltsch F, Kaczensky P, Kane A, Kappeler PM, Kauffman M, Kays R, Kimuyu D, Koch F, Kranstauber B, LaPoint S, Leimgruber P, Linnell JDC, López-López P, Markham AC, Mattisson J, Medici EP, Mellone U, Merrill E, de Miranda Mourão G, Morato RG, Morellet N, Morrison TA, Díaz-Muñoz SL, Mysterud A, Nandintsetseg D, Nathan R, Niamir A, Odden J, O’Hara RB, Oliveira-Santos LGR, Olson KA, Patterson BD, Cunha de Paula R, Pedrotti L, Reineking B, Rimmler M, Rogers TL, Rolandsen CM, Rosenberry CS, Rubenstein DI, Safi K, Saïd S, Sapir N, Sawyer H, Schmidt NM, Selva N, Sergiel A, Shiilegdamba E, Silva JP, Singh N, Solberg EJ, Spiegel O, Strand O, Sundaresan S, Ullmann W, Voigt U, Wall J, Wattles D, Wikelski M, Wilmers CC, Wilson JW, Wittemyer G, Zięba F, Zwijacz-Kozica T, Mueller T. 2018. Moving in the Anthropocene: Global reductions in terrestrial mammalian movements. Science 359: 466–469.


Sincerely,

Jon

Monday, December 3, 2018

December 2018 science journal article summary

Cool insect eggs (Harlequin bug)

Greetings,

Here are some articles focused on pest control (the photo above is of harlequin bug eggs on kale), food safety, climate change, evidence, and even beer! Let me know if you need a copy of any of them. If you know someone who wants to sign up to receive these summaries, they can do so at http://bit.ly/sciencejon


CLIMATE CHANGE / NATURAL CLIMATE SOLUTIONS:
Almost everyone who works for or closely with The Nature Conservancy heard about the 2017 "Natural Climate Solutions" paper (Griscom et al. 2017, I reviewed it in November 2017). If you've been waiting for the sequel - good news! Fargione et al. 2018 just provided a similar analysis specifically for the United States. It's short, excellent, and worth reading, but if you're impatient skip to Figure 1. That summarizes the potential of each pathway and splits out how much is achievable at different carbon prices. They found a maximum potential of 1.2 Pg (aka 1200 million metric tons) CO2e / yr (21% of current US emissions and ~27% of 2005 emissions), and ~300 Tg (million metric tons) achievable at $10 / t CO2e (~5% of US emissions). The biggest low cost opportunities are in planting cover crops followed by forest management, avoided habitat conversion, and improved farm nutrient management. You can read more about it on TNC's web site at https://www.nature.org/en-us/explore/newsroom/natural-climate-solutions-study/ or at https://eurekalert.org/pub_releases/2018-11/cu-nsr111418.php

ORGANIC AGRICULTURE / FOOD SAFETY:
This is an interesting study on how consumption of organic vs. conventional foods affects cancer risk. They did find the people who ate the most organic food had 24% less cancer compared to the people who ate the least (even after controlling for quite a few lifestyle and diet variables, see Model 3 in Table 2). Unfortunately, they didn't test for pesticide residue (to confirm the hypothesis that pesticide was driving these results), there was a short follow-up time, they used a single unvalidated diet assessment, and there are enough odd findings (e.g. finding processed meat intake doesn't intake cancer risk) to make me suspect they didn't discover a causative relationship. I also don't understand how their model could find the organic diet has such a strong impact on cancer but then find that people eating a high quality diet AND lots of organic food didn't have reduced risk relative to those eating a low quality diet and little organic food (and supplemental table 6 looks like there IS a reduced risk although perhaps the confidence interval is too high to state it definitively). In short, this was an interesting paper but I don't think it is strong evidence for the conclusions they present. You can read a blog about this one at https://www.nytimes.com/2018/10/23/well/eat/can-eating-organic-food-lower-your-cancer-risk.html


EVIDENCE & DECISION MAKING:
To be effective in conservation, we need reliable evidence about the impact of different actions and strategies. This lets us focus on the strategies that will best help us reach our goals. Game et al. 2018 (led by TNC's Eddie Game) has timely guidance for how scientists should assess the quality of evidence (across multiple disciplines). They recommend beginning with a results chain to map out causal associations between actions, intermediate results, and outcomes, and then looking for the evidence of each link. They also note that in conservation a broader approach is needed than in other disciplines like medicine. The key point is the set of four principles they use to assess the strength of evidence. They are: variety (multiple types of evidence available), consistency (the evidence has consistent findings), credibility (the evidence comes from trusted sources), and applicability (the evidence matches the context of the issue being evaluated). You can read a blog about the paper at https://sustainabilitycommunity.nature.com/channels/1385-behind-the-paper/posts/38893-required-rethink-on-what-is-evidence

Bennett et al. 2018 is an attempt to make value of information (VOI) theory more practical. While still theoretical, they show how to apply VOI theory across multiple "management units." In each unit, the model compares two choices: acting with existing imperfect information, or doing more monitoring to support decision making. The revised model is a step forward, and I also enjoyed the discussion of limitations. For example, they mention that their model is risk neutral, which is often not the case with real decision makers.


CLIMATE CHANGE & BEER:
As we approach a major holiday season in the U.S., many people celebrate with alcohol. Xie et al. 2018 has a dire warning from the ghost of Christmas future: climate change may reduce barley yields (3-17%) and beer supply while driving up prices. Essentially they predict worsening drought and extreme heat will reduce barley production, and that during extreme years barley for beer will be reduced in favor of livestock feed and direct consumption. See Figure 3 for a nice summary of patterns of barley use by country now and under climate change. Some important limits: they don't predict future demand for beer (likely to increase), and they don't look at adaptation (e.g. making more beer w/ rice and corn as some major brewers do already, improved seed genetics, etc.). These caveats reinforce my skepticism of some predictions such as the price of beer in Ireland almost doubling (it's hard to imagine that could happen without a strong adaptive response). Nonetheless, most science predicting future food demand and supply focuses more on staples than luxuries, and this is an interesting twist.


REFERENCES:
Baudry, J., Ke, A., Touvier, M., Allès, B., Seconda, L., Latino-Martel, P., … Kesse-Guyot, E. (2018). Association of Frequency of Organic Food Consumption with Cancer Risk: Findings From the NutriNet-Santé Prospective Cohort Study. JAMA Internal Medicine. https://doi.org/10.1001/jamainternmed.2018.4357

Bennett, J. R., Maxwell, S. L., Martin, A. E., Chadès, I., Fahrig, L., & Gilbert, B. (2018). When to monitor and when to act: Value of information theory for multiple management units and limited budgets. Journal of Applied Ecology, 55(January), 2102–2113. https://doi.org/10.1111/1365-2664.13132

Deutsch, C. A., Tewksbury, J. J., Tigchelaar, M., Battisti, D. S., Merrill, S. C., Huey, R. B., & Naylor, R. L. (2018). Increase in crop losses to insect pests in a warming climate Downloaded from. Science, 361(August), 31. https://doi.org/10.1126/science.aat3466

Fargione, J. E., Bassett, S., Boucher, T., Bridgham, S. D., Conant, R. T., Cook-patton, S. C., … Griscom, B. W. (2018). Natural climate solutions for the United States. Science Advances, 4(November).

Game, E. T., Tallis, H., Olander, L., Alexander, S. M., Busch, J., Cartwright, N., … Sutherland, W. J. (2018). Cross-discipline evidence principles for sustainability policy. Nature Sustainability, 1(9), 452–454. https://doi.org/10.1038/s41893-018-0141-x

Karp, D. S., Chaplin-Kramer, R., Meehan, T., Martin, E., DeClerck, F., Grab, H., … Zou, Y. (2018). Crop pests and predators exhibit inconsistent responses to surrounding landscape composition. Proceedings of the National Academy of Sciences of the United States of America. https://doi.org/10.1073/pnas.1800042115

Waterfield, G., & Zilberman, D. (2012). Pest Management in Food Systems: An Economic Perspective. Annual Review of Environment and Resources, 37, 223–247. https://doi.org/10.1146/annurev-environ-040911-105628

Xie, W., Xiong, W., Pan, J., Ali, T., Cui, Q., Guan, D., … Davis, S. J. (2018). Decreases in global beer supply due to extreme drought and heat. Nature Plants. https://doi.org/10.1038/s41477-018-0263-1


Sincerely,

Jon

p.s. as a reminder, you can search all of the science articles written by TNC staff (that we know of) here http://www.conservationgateway.org/ConservationPlanning/ToolsData/sitepages/article-list.aspx
(as you publish please email science_pubs@tnc.org to help keep this resource current).
If you'd like to keep track of what I write as well as what I read, I always link to both my informal blog posts and my formal publications (plus these summaries) at http://sciencejon.blogspot.com/

Wednesday, November 1, 2017

November science journal article summary

Nihao November!


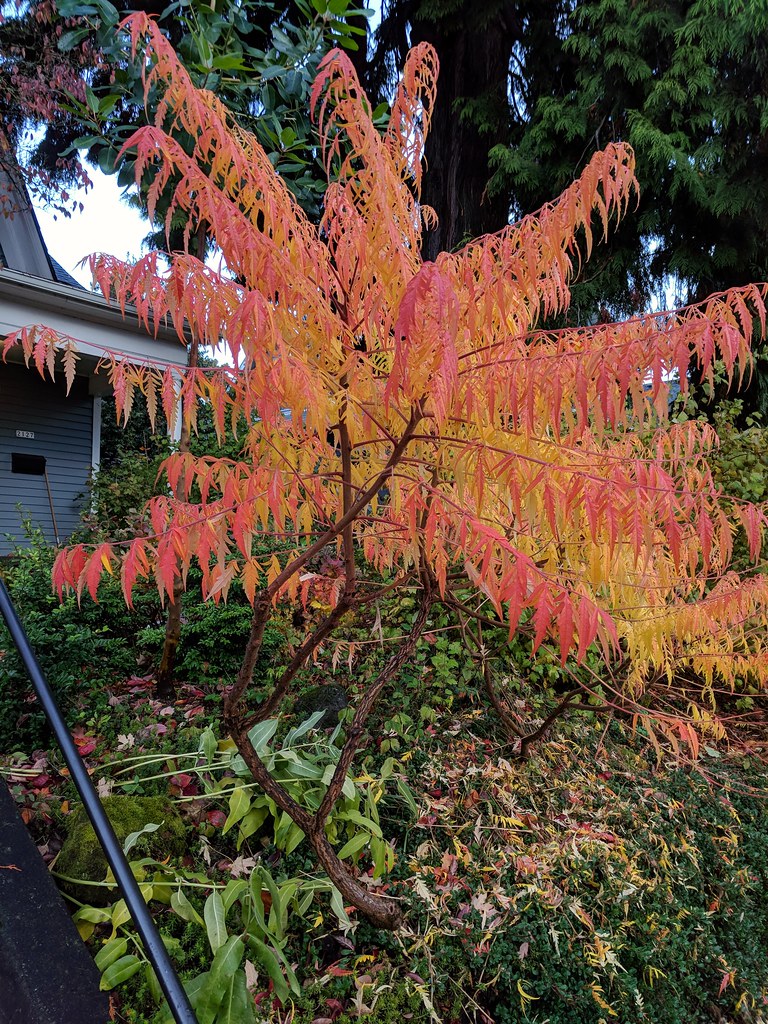
Fall sumac

I've got a good one for you this month! It's less focused than usual, but there are three key topics, plus a mix of a few others:
First, if you're about to delete this unread, please take this survey (which takes <1 minute) to let me know if you have input on how these summaries could be more useful: https://www.surveymonkey.com/r/BCVDKQR . Thanks to all who responded; results are summarized at the end of this email.

Second, the long-awaited "Natural Climate Solutions" paper from TNC is out. Read it: it's only 5 pages and will be highly relevant to virtually everyone working in conservation. It makes a solid case for how immediately investing in nature to reduce GHGs can buy us much-needed time to bring down emissions and invent new technology.

Third, a new book came out Oct 12: Effective Conservation Science: Data Not Dogma. It includes chapters from myself and several TNC authors, and is full of fascinating stories of how we react to science that counters conventional wisdom. I also share related articles below on how we can work through our biases.

CLIMATE CHANGE / NATURAL CLIMATE SOLUTIONS
Griscom et al 2017 (the natural climate solutions paper) packs a lot of good content in, but two things in particular excite me. First is making the case for massive rapid investment in nature: while we develop new tech and bring down emissions, we can use proven solutions like trees to buy time and make progress (see figure 2: nature could get us 37% of mitigation needs by 2030 at <$100/t CO2e / yr). We need the tech too, but nature is something that works today to bring down GHGs. Second is breaking down their top 20 options for nature-based climate mitigation into the theoretical maximum impact (about 1/2 of which would cost <$100 / t CO2e / yr), what we would need to hit Paris targets of <2 degrees C, and the subset of mitigation which is cheap (<$10/t CO2e / yr). See Figure 1 for this breakdown, which highlights that forests are absolutely critical (2/3 of cost-effective mitigation), and that the biggest opportunities for cheap mitigation are preventing forest loss (and improving forest management), improving fertilizer use on farms, and keeping peatlands intact. The forest goals rely heavily on a small reduction in grazing lands (4%). I'm leaving out lots of important details to keep this short: just read the paper. It's worth it. Read all about it (or watch videos) at https://global.nature.org/initiatives/natural-climate-solutions/natures-make-or-break-potential-for-climate-change

DATA NOT DOGMA:
The book Effective Conservation Science: Data Not Dogma tells stories of scientists whose unconventional and inconvenient results challenge us all to broaden our thinking and consider how we respond to new information that undermines what we think we know. My chapter is around how my analysis and blog post showing that globally agriculture has been taking up a smaller footprint since 1998. You can buy the book here: https://global.oup.com/academic/product/effective-conservation-science-9780198808985?cc=se&lang=en& and read a review of one chapter here: www.slate.com/articles/technology/future_tense/2017/08/conservation_biologists_are_struggling_to_balance_science_and_advocacy.html and read an ugly (unformatted) version of my chapter here: http://fish.freeshell.org/publications/DataNotDogma-Chapter11-preformatted.pdf  

Here are three more papers on the topic of scientific bias:
In 1992 E.O. Wilson asserted that invasive species were the second greatest driver of species extinction (second only to habitat destruction). He did so without providing evidence or details behind his calculations, but this claim was rapidly repeated and taken as gospel by environmental scientists. In fact, TNC played a major role in elevating Wilson's claim by not only citing it (in a BioScience paper and related book), but adding that "scientists generally agree" with Wilson's claim (again without evidence). Chew 2015 tells the captivating story about how this happened, using clear writing, thought-provoking questions, and numerous examples of bias in language that should be neutral and scientific. He also tells us how the idea eventually became subject to critique. I have seen this phenomenon firsthand; I follow a trail of citation breadcrumbs from authors to discover a primary source with an assertion that cannot be supported by what's in the paper (e.g. a book chapter on soil by Rattan Lal). When scientists don't closely read the papers we cite (or read them at all), our biases blossom and spread. If you're interested in invasive species or how spurious claims spread, this is a great read (albeit long).

Warren et al 2017 asks how common it is for scientists to be biased with regard to invasive species: using value-laden language and favoring interpretation that emphasizes the impacts of invasive species even when the data are not clear (as exemplified by the Chew 2015 article). They found bias to be common, but also that it has been declining since a series of papers in 2004-2005 that argued against language vilifying invasive species. This paper is fairly simplistic but gets at a key nuance: even a bias which is generally true is counter-productive in science. This paper shows hope that with awareness of bias, we can make efforts to at least reduce the expression of that bias in our work.

Holman et al 2015 provides more evidence of scientific bias, and argues for the use of "blinding" when conducting research to limit the potential for bias to affect study results. This means scientists collecting data don't know whether the subjects or area they're observing is a treatment or a control. This makes it harder for preconceptions to affect measurements (whether subjective, or even "rounding" seemingly objective metrics to fit bias), and they present evidence that nonblind studies often inflate the effect of the actions being studied. If "working blind" sounds extreme to you, read my blog post about "Clever Hans" - a horse who was believed to be able to do math (but in fact was only skilled at reading when his audience believed he had the right answer): https://blog.nature.org/science/2015/02/12/horses-doing-math-clever-hans-lessons-conservation-science/

As a final thought on bias, check out the Minasny & McBratney article in the Soil section below, which challenges a key assertion for TNC's agriculture work (that boosting soil organic matter improves water holding capacity). Read the summary below, and observe your feelings and reaction if it challenges what you believe.

SOIL
Minasny & McBratney 2017 use a meta-analysis to argue against something generally believed to be true by people working on sustainable agriculture: they provide evidence that increasing soil organic matter has a relatively small effect on water holding capacity (particularly for plant-available water content). If they're right, it reduces TNC's argument that improving soil health via boosting organic matter on farms will substantially improve crop resilience to drought. The authors note that soils that benefit most from increases in organic matter are sandy and very low in organic matter to begin (both of which make sense). They have a good discussion of limitations of their analysis, in particular the fact that they focused only on soil and not what's above it. Cover crops and crop residue / stubble are likely to add to the small benefits shown via soil. There is also a lot of nuance and potential to reframe their analysis in a way that could show larger benefits. At the same time, recognizing that most of us have a bias on this topic, this is a useful reminder to check our assumptions about both the efficacy of practices and the key mode of action and metrics that we should focus on. The authors led a key paper on the "4 per mille" initiative on boosting soil carbon, so are not hostile to the notion of boosting soil carbon. You can read a news article about this one here: https://phys.org/news/2017-10-adding-soil-limited-effect-capacity.html

GENERAL ECOLOGY / BIODIVERSITY
Remember as a kid how many bugs would get splattered on the windshield of your car? Ever notice there are less now? A recent study (Hallman et al 2017) indicates this is a real phenomenon, with dramatic declines in flying insects. The authors tracked the total biomass of insects at 63 locations within nature preserves in Germany; from 1989 to 2016 biomass plummeted by 76%. They sampled several habitat types and found consistent declines. It's alarming to see this within protected areas, although the authors note virtually all are surrounded by agriculture. That could both pull insects away from natural areas, and provide more pesticide drift into the natural areas. Other studies have shown major insect declines, but none this severe, and I don't know of others within protected areas.

SCIENCE COMMUNICATIONS
I've been pondering what we think we know and how to communicate thorny issues (as per data not dogma). I'd recommend a book I'm reading: "Do I make myself clear?" by Harold Evans, which is helping me. While not for scientists, I saw my writing sins laid bare in this book. I'm looking to simplify my writing in science papers, and to better talk about science in general. I have a long way to go! I'm working on summarizing key lessons amidst all of the stories in the book. One useful tool is the Hemingway app, which helps you identify problematic text and how to improve it: http://www.hemingwayapp.com/

AGRICULTURE:
As noted in my August 2017 review, neonicotinoids (neonics for short) are a class of insecticide currently under close scrutiny for impacts on bees. Mitchell et al 2017 found neonics in 75% of the 198 honey samples they tested, although mostly at very low levels. All neonics were at safe levels for humans, and most were at levels considered safe for bees. This is useful to show both that these pesticides are very common, that they are being consumed by bees, and that they often occur in concert with other neonics (all of which is concerning). But the reporting (and fundraising) around this has glossed over the very low levels. While 48% of samples had total neonic levels over a very conservative threshold for potential harm to bees (0.1 ng / g, a more reasonable (still likely conservative, albeit arbitrary) threshold of 2 ng / g was only detected in 8% of samples. The honey was collected via "citizen science"; the researchers asked colleagues, friends, and family to bring them honey produced in a known location. That also raises the question of whether or not these honey samples are typical.


RESULTS FROM SURVEY ABOUT THESE SUMMARIES:
I'm guessing the folks who didn't respond would have had more critical feedback, but overall here's what I learned from the ~40 respondents:
  • 90% of you usually at least skim these for relevant content
  • 90% of you found the level of detail about right (including some who said they could use less detail but were content to tolerate the current length), the rest found them too long.
  • Several folks especially liked both grouping articles by topic, and focusing each month primarily on one topic. I'll endeavor to keep that up, despite failing to do so this month.
Some opportunities to improve I'll be mulling over:
  • Set up a monthly journal club to talk about the papers (this one is already in the works, stay tuned for more info and let me know if you would like to provide input)
  • Make a lead theme more clear up front and include a short summary of the entire email
  • Tie each article to TNC's shared conservation agenda
  • Each quarter send a list of bullets of main issues under debate in conservation to encourage us to follow up
REFERENCES:
Chew, M. K. (2015). Ecologists, Environmentalists, Experts, and the Invasion of the “Second Greatest Threat.” International Review of Environmental History, 1, 7–41. Retrieved from http://www.academia.edu/14884830/Ecologists_Environmentalists_Experts_and_the_Invasion_of_the_Second_Greatest_Threat 

Evans, H. (2017). Do I make myself clear? Why writing well matters. Little, Brown, and Company: New York, NY. 416p.

Fisher, J. R. B. (2017). Global agricultural expansion – the sky isn’t falling (yet). In Kareiva, P., Silliman, B, and Marvier, M. (Eds), Effective Conservation Science: Data not Dogma. Oxford University Press, Oxford, UK, pages 73-79. https://global.oup.com/academic/product/effective-conservation-science-9780198808985?cc=se&lang=en&

Griscom, B. W., Adams, J., Ellis, P. W., Houghton, R. A., Lomax, G., Miteva, D. A., … Fargione, J. (2017). Natural Climate Solutions. Proceedings of the National Academy of Sciences, (6), 11–12. https://doi.org/10.1073/pnas.1710465114

Hallmann, C. A., Sorg, M., Jongejans, E., Siepel, H., Hofland, N., Schwan, H., … de Kroon, H. (2017). More than 75 percent decline over 27 years in total flying insect biomass in protected areas. Plos One, 12(10), e0185809. https://doi.org/10.1371/journal.pone.0185809

Holman, L., Head, M. L., Lanfear, R., & Jennions, M. D. (2015). Evidence of experimental bias in the life sciences: Why we need blind data recording. PLoS Biology, 13(7), 1–12. https://doi.org/10.1371/journal.pbio.1002190

Minasny, B., & Mcbratney, A. B. (2017). Limited effect of organic matter on soil available water capacity. European Journal of Soil Science, (2000), 1–9. https://doi.org/10.1111/ejss.12475

Mitchell, E. A. D., Mulhauser, B., Mulot, M., & Aebi, A. (2017). A worldwide survey of neonicotinoids in honey. Science, 111(October), 109–111. https://doi.org/10.1126/science.aan3684

Warren, R. J., King, J. R., Tarsa, C., Haas, B., & Henderson, J. (2017). A systematic review of context bias in invasion biology. PLoS ONE, 12(8), 1–12. https://doi.org/10.1371/journal.pone.0182502