Showing posts with label floods. Show all posts

Thursday, May 1, 2025

May 2025 science summary

Sea lion yawning in Valdivia


Merry May,

This month I've got four articles on freshwater, plus one on whether climate mitigation can be harmful to wildlife if done wrong (spoiler: yup).

If you know someone who wants to sign up to receive these summaries, they can do so at http://bit.ly/sciencejon (no need to email me).

FRESHWATER:
Petry et al. 2025 has predictions of changing streamflow and flooding across South America by 2100 under a moderate climate change scenario. Figure 4 has the key findings about how much more or less frequent floods may be. Note that “RP” means “return period” as in a “5 year flood” or “100 year flood” (the magnitude of flooding you’d expect on that frequency / rarity, so higher numbers mean more severe flooding). RPCF means how much more or less frequent those floods would be (with negative sign indicating less frequent flooding, e.g. the -2 on the Paraguay river in the Pantanal means half as often). But much more flooding is expected in Peru, Ecuador, Colombia, and Southern Brazil, and parts of the Amazon will see 1/10 as much flooding as they historically have. They find Pantanal floods (in the Paraguay River and some tributaries like Cuiaba and Negro) will be roughly half as frequent and half as severe, they don’t have a clear trend in the Chaco, and in Chile the area from roughly Santiago to Valdivia has some rivers where flooding will be ~2-3 times less frequent while the northern part of Chile will only see slightly less flooding.

Lehner et al. 2024 is a summary of a new "Global Dam Watch (GDW)" open dataset of 41,000 river barriers and 35,000 reservoirs (see Fig 1 for a map). While national and regional datasets are more complete (e.g., NID has 90k points in the US, AMBER has 630k in Europe), this is the most comprehensive free global dataset (see Table 2) and it includes estimated reservoir volumes mostly for reservoirs >10 km2.

Cho et al. 2023 did a ton of modeling (Fig 7) to estimate how conservation (mostly reforestation along streams) could have affected the water supply of São Paulo. They found the increased habitat could serve as an "invisible reservoir" for water in soil, and in a highly idealized scenario (lots of new forest in all the right places among others) streamflow could be boosted by 33% (and drought costs reduced by 28%). They don't report numeric results for their less ideal scenarios, and all scenarios exclude the water consumption of growing trees. In a conversation with one of the study's authors, they mentioned that it likely took about 30 years (I think) for the "water savings" of nature (fog capture plus slowing down runoff during high rain events) to outweigh the water consumption of growing trees. In other words, in this case in the short term adding trees could result in lower streamflow even though in the long run it would increase streamflow. Understanding the timeline and tradeoffs is key so people who live there know what to expect. From chatting w/ other hydrologists about this, it's clear that results like this vary a lot depending on things like soil type, weather and climate, type of forest, and much more. There's an article about this one at https://www.nature.org/en-us/about-us/where-we-work/latin-america/brazil/stories-in-brazil/invisible-reservoir/

Pompeu 2025 quantitatively models how different drivers have impacted total water surface area (as a decent proxy for total flow / water quantity) in the Pantanal. The paper found the biggest driver of water level was 1) the presence or absence of having natural vegetation at least 50m around springs, followed by 2) natural veg riparian buffers along rivers (buffer width increasing w/ river width as per the Forest Code), followed by 3) replacing conventional monoculture ag w/ something w/ deeper root systems (agroforestry, permaculture, full restoration if feasible, etc.), followed by 4) preventing more dams.


CLIMATE MITIGATION AND WILDLIFE:
Smith et al. 2025 asks what the net impact of climate mitigation on land (including bioenergy crops, reforestation, and afforestation) is on the total habitat area for 14,000 vertebrate species. Fig 1 summarizes the idea well - climate change can reduce suitable habitat, but climate mitigation can also either add or remove habitat directly. Fig 4 has their global recommendations - basically leave most ecosystems alone, reforest several areas (SE Asia, Eastern US, Mexico, and much of Europe) and in a few tiny places grow bioenergy crops. In other words, typically planting trees on grasslands or other habitat types destroys more habitat than it saves through climate mitigation. But planting trees in cleared forests is a win-win.


REFERENCES:
Cho, S. J., Klemz, C., Barreto, S., Raepple, J., Bracale, H., Acosta, E. A., Rogéliz-Prada, C. A., & Ciasca, B. S. (2023). Collaborative Watershed Modeling as Stakeholder Engagement Tool for Science-Based Water Policy Assessment in São Paulo, Brazil. Water, 15(3), 401. https://doi.org/10.3390/w15030401

Lehner, B., Beames, P., Mulligan, M., Zarfl, C., De Felice, L., van Soesbergen, A., Thieme, M., Garcia de Leaniz, C., Anand, M., Belletti, B., Brauman, K. A., Januchowski-Hartley, S. R., Lyon, K., Mandle, L., Mazany-Wright, N., Messager, M. L., Pavelsky, T., Pekel, J.-F., Wang, J., … Higgins, J. (2024). The Global Dam Watch database of river barrier and reservoir information for large-scale applications. Scientific Data, 11(1), 1069. https://doi.org/10.1038/s41597-024-03752-9

Petry, I., Miranda, P. T., Paiva, R. C. D., Collischonn, W., Fan, F. M., Fagundes, H. O., Araujo, A. A., & Souza, S. (2025). Changes in Flood Magnitude and Frequency Projected for Vulnerable Regions and Major Wetlands of South America. Geophysical Research Letters, 52(5). https://doi.org/10.1029/2024GL112436

Pompeu, J. (2025). Cross-Boundary Drivers of Water Cover Reduction in the Pantanal Wetland and Implications for its Conservation. Wetlands, 45(3), 32. https://doi.org/10.1007/s13157-025-01916-w

Smith, J. R., Beaury, E. M., Cook-Patton, S. C., & Levine, J. M. (2025). Variable impacts of land-based climate mitigation on habitat area for vertebrate diversity. Science, 387(6732), 420–425. https://doi.org/10.1126/science.adm9485


Sincerely,
 
Jon

p.s. This is a sea lion lazing about in Valdivia who happened to yawn as I was watching them.

Tuesday, April 1, 2025

April 2025 science summary

Drum circle at work

Hello,


This month I thought people might be interested in a short overview I pulled together about some of the fires in recent years and the impact they've had (instead of only detailed summaries of each paper). Let me know what you think! I do have normal summaries of four papers on fire (two mentioned in the overview) as well.

If you know someone who wants to sign up to receive these summaries, they can do so at http://bit.ly/sciencejon (no need to email me).

FIRE OVERVIEW:
Earlier this year in and around one of the largest cities in the US, almost 50,000 acres burned (https://www.fire.ca.gov/incidents/2025), destroying >16,000 buildings, displacing tens of thousands of people, and causing an estimated damage of >$250 billion dollars (https://www.nbcnews.com/news/us-news/california-wildfires-what-we-know-palisades-eaton-los-angeles-rcna188239).  This follows an exceptional fire season across North and South America in 2024 (https://earth.org/north-and-south-america-endured-exceptional-wildfire-season-in-2024/). 

Experts estimate that there has been a “ten‑fold increase in the frequency of fire regime change during the last 250 years,” (Sayedi et al. 2024) and wildland fuels have almost universally been getting dryer over the last 40 years (Ellis et al. 2022). While fire is normal in many ecosystems (and essential in some), we also have many recent examples of fires which devastated nature due to unusual severity, scale, speed, and return intervals. For example, in 2019-20, after severe drought in Australia a fire burned over 25 million acres (>100,000 km2) and “killed or displaced an estimated 3 billion mammals, birds, frogs, and reptiles” (Legge et al. 2023). The Pantanal has had increasingly common severe fires, e.g., in 2020 almost half of the ~10 million acres that burned hadn’t burned before in the last 20 years (Garcua et al. 2021), killing roughly 17 million vertebrates (Tomas et al. 2021). 

In some cases severe fire can also lead to high greenhouse gas emissions, especially for peatlands. For example, in 1997-8 Indonesian peat fires emitted a gigaton of carbon (~15% of global fossil fuel emissions, Turetsky et al. 2015). 

There is hope: our ability to remotely detect forest fires early is improving (Barmpoutis et al. 2020), and Indigenous fire brigades have shown promise as a low-cost way to dramatically reduce harmful wildfire (Ribeiro et al. 2023). 


SUMMARIES OF SPECIFIC FIRE PAPERS:
GLOBAL FIRE:

Ellis et al. 2022 is a global analysis of fire risk over the past 41 years, using estimated moisture trends in fuel (surface litter and dead plant debris) as the key metric. Fig 2a shows the % of days during the fire season where fuel moisture is expected to be below 10% (and thus at high fire risk), while 2b shows the total # of fire season days at high fire risk and Fig 4 shows the trend in high fire risk over time (36% of ecoregions are drying vs. only 4% getting wetter). They note that days w/ dry fuel isn't the only key driver of risk; consistent dry conditions limit fuel accumulation and thus the risk of severe fire. So surprisingly historically wet forests which accumulate lots of plant matter in wet years between fires may be the most at risk (as other research has shown).


FIRE IN SOUTH AMERICA:
Feron et al. 2024 analyzes how fire risk in South America has increased in the last 52 years (especially in the North Amazon). They estimate fire risk by combining the increasing number of warm days, dry days, and flammable days (combined in Fig 3). El Niño worsens risk in the Nothern Amazon, but lessens it in the Gran Chaco (where La Niña worsens the risk). The northeast part of the Gran Chaco has seen the most increase in fire risk (Fig 1a). The authors note that where humans set fires is also a key driver of wildfires spreading. In the Amazon severe fire has caused local warming (from black carbon) and decreasing rainfall.

Barros-Rosa et al. 2025 is a complex analysis of water and fire in the Pantanal and Planalto in Brazil. They looked at changes in land use and water and fire from 1985 to 2022. They found 1) open water in the Pantanal dropped from 20% to 5% (this analysis has a very high rate of error and variance so the precise numbers are likely wrong but the overall drying trend is valid), 2) forest and savanna were cleared for cattle (replacing them with exotic grass - doubling in the Planalto and tripling in the Pantanal), although 3) native grasslands also doubled in the Pantanal. They also find areas that have dried out are the most affected by wildfires. The authors also highlight existing policies allowing massive conversion of habitat to exotic grass, and allowing artificial drainage in wetlands outside the Pantanal.

Oliveira et al. 2025 argues that rigid "burn windows" when prescribed fire should be done works poorly in wetlands like the Pantanal (where the government limits prescribed fire to the beginning of the dry season (BDS), a ~5 month period as shown in Fig. 2). Burn windows remain important: prescribed fire requires considering both fuel loads and how wet or dry it is to ensure fire can burn but remains contained, as well as things like wind direction that could affect human health. But flooding combines w/ rainfall to determine actual fuel loads, limiting the utility of prescribed fire when rain is low but flooding remains. Considering river height as a proxy for flooding they find the end of the BDS is typically ideal for prescribed fire (although varying year to year, Fig. 6) even though rainfall is much lower than the beginning of BDS when flooding limits the use of prescribed fire (Fig. 4b and 4c). But they note that in the Northern Pantanal where rain and flood are more aligned than the Southern Pantanal the burn window is longer and more predictable (Fig. 5). The conclude that in wetlands like the Pantanal burn windows should be dynamic year to year and consider flooding as well as rainfall. One key point: prescribed burning is more important in high flood years, b/c while the window is shorter, flooding allows more vegetation to accumulate which raises the risk of fire once floods recede (we've often see severe fires in the Pantanal the year after a very wet year).


REFERENCES FOR PAPERS SUMMARIZED INDIVIDUALLY:
Ellis, T. M., Bowman, D. M. J. S., Jain, P., Flannigan, M. D., & Williamson, G. J. (2022). Global increase in wildfire risk due to climate‐driven declines in fuel moisture. Global Change Biology, 28(4), 1544–1559. https://doi.org/10.1111/gcb.16006

Feron, S., Cordero, R. R., Damiani, A., MacDonell, S., Pizarro, J., Goubanova, K., Valenzuela, R., Wang, C., Rester, L., & Beaulieu, A. (2024). South America is becoming warmer, drier, and more flammable. Communications Earth & Environment, 5(1), 501. https://doi.org/10.1038/s43247-024-01654-7

Barros-Rosa, L., Moura Peluso, L., Lemes, P., Johnson, M. S., Dalmagro, H. J., Nunes da Cunha, C., Zanella de Arruda, P. H., Mateus, L., & Penha, J. (2025). The ineffectiveness of current environmental and fire policies in the world’s largest wetland. Environmental Research Letters, 20(3), 034039. https://doi.org/10.1088/1748-9326/adb7f5

Oliveira, M. da R., Pereira, A. de M. M., Bao, F., Ferreira, B. H. dos S., Fernando, A. E., Roque, F. de O., Pott, A., Damasceno-Junior, G. A., & Neves, D. R. M. (2025). Designing Burn Windows for Integrated Fire Management in Wetlands: Why Should Flooding Not Be Overlooked? Wetlands, 45(4), 35. https://doi.org/10.1007/s13157-025-01919-7


REFERENCES FOR OTHER PAPERS IN OVERVIEW:
Barmpoutis, P., Papaioannou, P., Dimitropoulos, K., & Grammalidis, N. (2020). A Review on Early Forest Fire Detection Systems Using Optical Remote Sensing. Sensors, 20(22), 6442. https://doi.org/10.3390/s20226442

Garcia, L. C., Szabo, J. K., de Oliveira Roque, F., de Matos Martins Pereira, A., Nunes da Cunha, C., Damasceno-Júnior, G. A., Morato, R. G., Tomas, W. M., Libonati, R., & Ribeiro, D. B. (2021). Record-breaking wildfires in the world’s largest continuous tropical wetland: Integrative fire management is urgently needed for both biodiversity and humans. Journal of Environmental Management, 293(April), 112870. https://doi.org/10.1016/j.jenvman.2021.112870

Legge, S., Rumpff, L., Garnett, S. T., & Woinarski, J. C. Z. (2023). Loss of terrestrial biodiversity in Australia: Magnitude, causation, and response. Science, 381(6658), 622–631. https://doi.org/10.1126/science.adg7870

Ribeiro, D. B., & Pereira, A. M. M. (2023). Solving the problem of wildfires in the Pantanal Wetlands. Perspectives in Ecology and Conservation, 21(4), 271–273. https://doi.org/10.1016/j.pecon.2023.10.004

Sayedi, S. S., Abbott, B. W., Vannière, B., Leys, B., Colombaroli, D., Romera, G. G., Słowiński, M., Aleman, J. C., Blarquez, O., Feurdean, A., Brown, K., Aakala, T., Alenius, T., Allen, K., Andric, M., Bergeron, Y., Biagioni, S., Bradshaw, R., Bremond, L., … Daniau, A.-L. (2024). Assessing changes in global fire regimes. Fire Ecology, 20(1), 18. https://doi.org/10.1186/s42408-023-00237-9

Tomas, W. M., Berlinck, C. N., Chiaravalloti, R. M., Faggioni, G. P., Strüssmann, C., Libonati, R., Abrahão, C. R., do Valle Alvarenga, G., de Faria Bacellar, A. E., de Queiroz Batista, F. R., Bornato, T. S., Camilo, A. R., Castedo, J., Fernando, A. M. E., de Freitas, G. O., Garcia, C. M., Gonçalves, H. S., de Freitas Guilherme, M. B., Layme, V. M. G., … Morato, R. (2021). Distance sampling surveys reveal 17 million vertebrates directly killed by the 2020’s wildfires in the Pantanal, Brazil. Scientific Reports, 11(1), 23547. https://doi.org/10.1038/s41598-021-02844-5

Turetsky, M. R., Benscoter, B., Page, S., Rein, G., Van Der Werf, G. R., & Watts, A. (2015). Global vulnerability of peatlands to fire and carbon loss. Nature Geoscience, 8(1), 11–14. https://doi.org/10.1038/ngeo2325

Sincerely,
 
Jon
 
p.s. The picture is of the first drum circle I ever attended, which was at work during  a "learning week" event for my department!
p.p.s. Nothing in this post is an April Fool's joke or untrue in any way as far as I know :)

Tuesday, March 1, 2022

March 2022 science summary

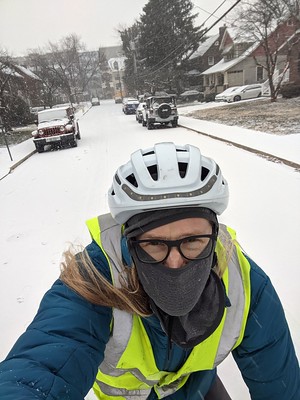
Winter biking


 Hello,


I've got a mix of papers this month but most relate to climate change (priorities for mitigation and adaptation, impacts on flooding, and how to plan for it) plus a couple of wildlife movement. 

If you know someone who wants to sign up to receive these summaries, they can do so at http://bit.ly/sciencejon (no need to email me).

CONSERVATION PRIORITIES / 30x30 / CLIMATE ADAPTATION:
Dreiss & Malcom 2022 is an analysis of priorities for protection under 30x30, considering hotspots of biodiversity and carbon, current protection (Fig 2), and threats. The two threats are risk of conversion (to non-habitat by 2050) and climate vulnerability (need for habitat / species to migrate elsewhere to survive, expressed in km/yr). They have two sets of hotspots, one with the top 10% of biodiversity (they calculated both imperiled species richness, and imperiled species range-size-rarity which captures how much habitat rare spp. have left), and one with the top 10% of carbon pools (not actual GHG mitigation potential, as it omits deep carbon like peat, other GHGs, and the albedo effect). Fig 3 has maps of their main results, but they're easier to see and explore in the interactive map at https://arcg.is/0SjGLK. Fig 4 highlights high conversion risk (>50%) and climate vulnerability for hotspots (top 10%) of biodiversity and carbon (4a = conversion & richness, 4b = conversion & carbon, 4c = climate vuln. & richness, 4d = climate vuln. & carbon). Upgrading all existing less strict protected areas (GAP 3) would achieve ~30% protection, but that would miss 80% of biodiversity hotspots (which are on private land). Similarly, 21% of unprotected biodiversity hotspots have at least a 50% chance of being converted by 2050. The authors didn't include political, social, or economic considerations, but there are still a lot of useful data in here.

Dreiss et al. 2022 identifies priority conservation locations within the contiguous US to support climate adaptation (via refugia and corridors). Fig 4c shows which climate refugia and corridors are unprotected (in gray) or underprotected (GAP 3 in orange). The bottom two rows in Table 3 shows that the best places for climate adaptation mostly don't overlap with the best places for biodiversity or carbon (~20-25% do). This means that focusing solely on biodiversity or carbon hotpsots is likely to miss critical refugia and corridors to help ensure resilience to climate change.


CLIMATE CHANGE IMPACTS:
Wing et al. 2022 modeled increasing US flooding risks due to both climate change (by 2050 under RCP4.5, which is 'medium' emissions but still means aggressive decarbonization) and changing populations. Note that the paper uses 'risk' in the engineering sense: likelihood of impact times magnitude of impact (so risk is reported as expected annual $ losses due to floods). Those losses are expected to go up 26% just from climate change (calculated at the building level based on current population data), but considering both climate change and population change they predict almost twice as many people will be impacted by flood each year (with that impact driven largely by population growth). The highest current flood risk is in predominantly white and extremely poor counties (partly b/c very poor people in areas at risk of floods have few financial assets not vulnerable to floods, so their relative risk is higher). The counties with the highest % Black population are expected to see twice as much risk increase by 2050 as counties with the fewest Black people. This is due a mix of increasing flooding risk in the Deep South, and the relatively low current risk of mostly Black counties. You can read more about this at https://www.washingtonpost.com/business/2022/01/31/climate-change-flooding-united-states/

Brown et al. 2022 has a good overview of recent improvements to incorporating climate change into conservation planning via the Conservation Standards (aka Open Standards for the Practice of Conservation). If you're not familiar with the Standards, this paper will be a bit overwhelming, but still has useful tidbits. Jump to figure 4 for a very helpful diagram of physical changes expected to result from climate change, and which of these changes make sense to classify as "direct climate threats" (in red text). What I love about this is it helps you move past (climate change will affect everything) and identify the specific changes that a) will affect focal species and ecosystems, and b) which you can affect via conservation. So rather than focusing on changes to rain, they identify decreased water availability and increased risk of landslides as climate threats. Then Fig 5b shows how the climate threats are integrated w/ other direct threats and linked to conservation targets (the species and ecosystems being prioritized for action). If you can handle switching examples, Figs 6 and 7 show how to move from a situation model (linking threats to targets and identifying possible strategies) to a results chain (showing the desired interim results and ultimate impacts of a strategy). There is some updated guidance available since this was published on the CMP web site.


WILDLIFE MOVEMENT / MIGRATION:
Merkle et al. 2022 addresses the problem that species which favor returning to fixed places to forage / breed / shelter have a hard time adjusting to habitat loss and resulting fragmentation. Figure 2 has a good example: mule deer in WY staying true to winter range despite oil & gas development, which the authors give as an example of an 'ecological trap' due to 'site fidelity' (they keep coming back even if they have better alternatives). They call for more research on what drives site fidelity (genetics, environmental conditions, or a mix), and for conservation plans to account for site fidelity rather than assuming animals will choose the best habitat possible.

Vynne et al. 2022 is a global analysis to find terrestrial ecoregions where only 1-3 large mammals (>33 lb, 298 species) are missing from the mammals that present 500 years ago (Fig 2 has a map of those results). Given the impact large mammals have on ecosystems, the idea is that getting back to the full suite of mammals that used to be there will have broader effects. But this is an assumption the authors make, rather than a conclusion of the analysis (most news headlines have implied the latter). The best known example of that is the impact of reintroducing wolves to Yellowstone leading to a trophic cascade (although unfortunately those effects have been widely exaggerated due to non-random aspen sampling and failing to account for confounding effects of human hunting and changes in streamflow due to climate). Their 30 priority ecoregions for reintroduction / restoration are in Table 2 and Figure S3. They note the challenges in reintroducing predators in particular, including the need to plan to avoid human conflict and difficulty of securing protection over large areas to allow for connectivity).


REFERENCES:

Brown, M. B., Morrison, J. C., Schulz, T. T., Cross, M. S., Püschel-Hoeneisen, N., Suresh, V., & Eguren, A. (2022). Using the Conservation Standards Framework to Address the Effects of Climate Change on Biodiversity and Ecosystem Services. Climate, 10(2), 13. https://doi.org/10.3390/cli10020013

Dreiss, L. M., & Malcom, J. W. (2022). Title identifying key federal, state, and private lands strategies for achieving 30 × 30 in the United States. Conservation Letters, May 2021, 1–12. https://doi.org/10.1111/conl.12849

Dreiss, L. M., Lacey, L. M., Weber, T. C., Delach, A., Niederman, T. E., & Malcom, J. W. (2022). Targeting current species ranges and carbon stocks fails to conserve biodiversity in a changing climate: opportunities to support climate adaptation under 30x30. Environmental Research Letters, 2(1), 0–31. https://doi.org/10.1088/1748-9326/ac4f8c

Merkle, J. A., Abrahms, B., Armstrong, J. B., Sawyer, H., Costa, D. P., & Chalfoun, A. D. (2022). Site fidelity as a maladaptive behavior in the Anthropocene. Frontiers in Ecology and the Environment, 1–8. https://doi.org/10.1002/fee.2456

Vynne, C., Gosling, J., Maney, C., Dinerstein, E., Lee, A. T. L., Burgess, N. D., Fernández, N., Fernando, S., Jhala, H., Jhala, Y., Noss, R. F., Proctor, M. F., Schipper, J., González‐Maya, J. F., Joshi, A. R., Olson, D., Ripple, W. J., & Svenning, J. (2022). An ecoregion‐based approach to restoring the world’s intact large mammal assemblages. Ecography, 1–12. https://doi.org/10.1111/ecog.06098

Wing, O. E. J., Lehman, W., Bates, P. D., Sampson, C. C., Quinn, N., Smith, A. M., Neal, J. C., Porter, J. R., & Kousky, C. (2022). Inequitable patterns of US flood risk in the Anthropocene. Nature Climate Change. https://doi.org/10.1038/s41558-021-01265-6

Sincerely,
 
Jon
 
p.s. If you'd like to keep track of what I write as well as what I read, I always link to both my informal blog posts and my formal publications (plus these summaries) at http://sciencejon.blogspot.com/
p.p.s. As shown in the pic above - I am a committed winter biker, and my wife and I very much enjoyed Arlington's winter bike games recently!

Monday, March 1, 2021

March 2021 science summary

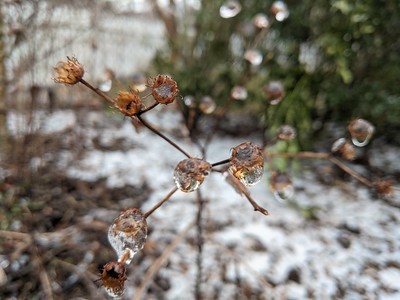
Ice balls on dead flowers

Hi,

As I write this, everything is encased in ice, so reading science with a cup of tea is pretty appealing!

I've summarized a few very useful articles on protected areas, all of which have useful insights (where to cite PAs for different goals, how they perform under climate change, and how to measure how well they protect a range of habitat types).

I've also got a paper on how flood damages have changed and how that relates to changing precipitation (and what we can expect with climate change), and one on shipping fuel regulations in China (impact on air quality, cost, and benefit:cost ratio).

If you know someone who wants to sign up to receive these summaries, they can do so at http://bit.ly/sciencejon


PROTECTED AREAS:

Jenkins et al. 2015 highlights an inconvenient truth about protected areas in the United States: they are mostly located in places with relatively low species richness and threats of conversion. In other words, if the main goal of protected areas is to prevent as many species as possible from going extent, they're poorly sited. You can compare biodiversity maps in Fig 1 & 2 to PAs in Fig 3 to see the mismatch. Fig 4 has their recommendations for 9 areas where conservation should be focused in the SE and West coast.

Jantke et al. 2019 proposes a clever way to ensure that "% protected" goals like 30 by 30 (protecting 30% of a country on land and water by 2030) don't focus on easy to protect habitat types while other habitat types remain mostly unprotected. They suggest reporting “mean target achievement” where the % protected of each habitat type would be averaged and compared to a habitat-level goal (See section 2.2 for the equation - crucially achievement maxes out at 100% so overprotection in one habitat can't compensate for underprotection in another). They use Australia's Commonwealth Marine Reserve as an example; it protects 43% of the five marine regions it covers, but still falls short of its goal of protecting at least 10% of each of the 53 bioregions within it. This is a great complement to the total % protected indicator, as ecological representation has badly lagged behind total protection, and the rush to protect a lot more area very quickly will make it very tempting to focus on the easiest habitats to protect even though many other habitats have little to no protection.

Simmons et al. 2021 (a non-peer-reviewed white paper) looks at a few options to meet 30 by 30 in the U.S. with four different focal objectives (all also minimizing acquisition cost): area alone, carbon sequestration and avoided emissions, landscape connectivity, and climate-resilient species and habitat. It’s a fairly coarse and simplistic assessment, but it does a good job highlighting the kinds of tradeoffs to consider when deciding which lands we advocate for protecting. Check out Figure 2  which shows how their four scenarios perform (on cost, ecosystem representation, and climate mitigation) and where they would protect across the lower 48 states. They close with recommending clear objectives to prioritize where to protect, focus protections on threatened areas, develop metrics to track progress and impact (including on issues like social equity), and use diverse options (beyond traditional protected areas) to provide protection. Check out the appendix for maps showing which areas are already somewhat protected (as GAP 3).

Zhu et al. 2021 analyzes forested protected areas (PAs) in the Appalachians and asks how well they will provide future habitat to birds, mammals, reptiles, and amphibians after climate change (allowing for migration). They found that climate change would worsen suitable habitat that PAs provide for mammals and amphibians, while improving habitat suitability for birds and reptiles (if they are freely able to migrate, if not all groups of species would fare worse). They also found that threatened species are more likely to have their habitat worsen (see Table 2); NatureServe's global ranks G1->G4 would see a decline in suitable habitat (although only G3 was statistically significant, and G5 significantly improved) while endangered species did significantly worse (with vulnerable and other less threatened species seeing smaller and non-significant changes). They recommend focusing protection on areas of high species richness in the Blue Ridge (and the Cumberland plateau) to a lesser extent) which will remain suitable habitat under climate change. One key caveat: the main paper assumed a high emissions scenario (RCP 8.5), with a more moderate climate scenario (RCP 4.5) modeled in Appendix S4 / Table S2.


FLOODS / CLIMATE CHANGE:

Davenport et al. 2021 analyzed historic data on precipitation and flood damages in the US. They found that as extreme precipitation (with maximum monthly precip being the most important) has increased over the past 30 years, so have flood damages. By comparing the recent past (30 yrs) to the prior 130 years, they estimate about 1/3 of recent flood damages ($73 billion) are attributable to the change in precipitation (Fig 3). They don't estimate how much of that is specifically due to anthropogenic climate change. Fig 5 has estimates of what we can expect in the future as climate change continues: the two left columns in the bottom row are the most useful. They represent the optimistic (column A) and pessimistic (column B) change in the top 1% of monthly precip. Note that even in regions expected to get dryer, the MAXIMUM rainfall will also increase (think flashier and more variable rainfall).


SHIPPING:

Zhu & Wang 2021 looks at the impact of regulations on shipping fuel in China. They found that ports w/ no penalty for non-compliance did not see improvements in air pollution, but others did. The total cost of the regulations was 4 times the price difference of the fuels, but the health benefits from the reduced pollution were >30 times as high as the cost.


REFERENCES:

Davenport, F. V., Burke, M., & Diffenbaugh, N. S. (2021). Contribution of historical precipitation change to US flood damages. Proceedings of the National Academy of Sciences, 118(4), e2017524118. https://doi.org/10.1073/pnas.2017524118

Jantke, K., Kuempel, C. D., McGowan, J., Chauvenet, A. L. M., & Possingham, H. P. (2019). “Metrics for evaluating representation target achievement in protected area networks.” Diversity and Distributions, 25(2), 170–175. https://doi.org/10.1111/ddi.12853

Jenkins, C. N., Van Houtan, K. S., Pimm, S. L., & Sexton, J. O. (2015). “US protected lands mismatch biodiversity priorities.” Proceedings of the National Academy of Sciences, 112(16), 5081–5086. https://doi.org/10.1073/pnas.1418034112

Simmons, B.A., Nolte, C., McGowan, J. (2021). Delivering on Biden’s 2030 Conservation Commitment. GDPC Working Paper 001/2021. Global Development Policy Center, Boston University.

Zhu, J., & Wang, J. (2021). “The effects of fuel content regulation at ports on regional pollution and shipping industry.” Journal of Environmental Economics and Management, 106, 102424. https://doi.org/10.1016/j.jeem.2021.102424

Zhu, G., Papeş, M., Giam, X., Cho, S., & Armsworth, P. R. (2021). “Are protected areas well-sited to support species in the future in a major climate refuge and corridor in the United States?” Biological Conservation, 255(March), 108982. https://doi.org/10.1016/j.biocon.2021.108982


Sincerely,


Jon