Showing posts with label evidence. Show all posts

Monday, February 2, 2026

February 2026 science summary

A four pound turnip

Greetings,


A new paper I'm a co-author on just came out in Conservation Letters. It's about what counts as a "rapid evidence assessment" and how to do one well. Here's a 275 word blog about it: https://sciencejon.blogspot.com/2026/01/new-paper-rapid-evidence-assessments.html , the full paper (~3400 words) is here: https://conbio.onlinelibrary.wiley.com/doi/10.1111/con4.70005 , and I've summarized it below.

For any other map nerds out there; Esri has a new web map to make it easy to see 40 years of USGS land cover data at https://links.esri.com/LCExplorer . There's a blog about it at https://www.esri.com/about/newsroom/arcnews/40-years-of-usgs-land-cover-data-in-arcgis-living-atlas

If you know someone who wants to sign up to receive these summaries, they can do so at http://subscribe.sciencejon.com (no need to email me).

FRESHWATER PROTECTION:
Until very recently, we didn't have a decent estimate of which rivers were protected across the United States! Comte et al. 2026 describes how the first such database (the National Protected Rivers Assessment) was compiled and launched in Feb 2025. Since freshwater-specific protection is rare it relies mostly on assumptions about how likely different kinds of terrestrial protection are to effectively conserve the 5 key ecological attributes (KEAs) of rivers (flow, water quality, connectivity, habitat, and fish/wildlife/plants/etc. - see Fig 1). They find 19% of river length (12% of CONUS river length) has "viable" protection, although only 0.9% is comprehensively protected. Note their bar for "viable" protection (good enough) is fairly low - a score of 1.25/5 on their index. The index combines length and KEAs, so a 1.25 could mean 25% of the river provides protection for each of the 5 KEAs (overlapping or distinct), or all the river has protection for 1 KEA, and 25% has protection for another, but the other 3 KEAs are unaddressed. Hypothetically a river w/ 100% protection on 4 KEAs would score as "comprehensive" protection but could lack any protection from water withdrawals that would make the river run dry. See Fig 4 for rivers in the best shape that are most important for drinking water. This is a super useful resource. Explore the data at https://map.myriver.americanrivers.org/


CARBON AND WATER FOOTPRINT OF AI:
Xiao et al. has granular state projections of demand for AI through 2030, plus the carbon and water footprint of AI in each state. They recommend trying to steer data center growth to four states (TX, MT, NE, SD) given relatively low water scarcity and abundance of renewable energy (and potential to expand wind and solar). With the middle case assumptions by 2030 AI's water footprint would only be ~0.2% of current US crop water footprint, and the energy consumption would be ~2% of current total electric power generation. AI can have important local impacts and is growing fast, but national impacts are still projected to be relatively small.


IMPACT EVALUATION:
Neugarten et al. 2025 is a good overview to how to evaluate if conservation worked or not. They define impact evaluation and key terms like counterfactuals (what would have happened w/o conservation), confounders (variables that make understanding impact harder), and cover different types of evaluation (randomized experimental, quasi-experimental, and qualitative methods). They also discuss why looking at trends alone can be misleading (wildlife population might be dropping, but would have dropped more w/o action). They conclude recommending impact evaluation for projects that are high stakes, expensive, over big areas, untested, and/or assume additionality.


RAPID EVIDENCE ASSESSMENTS:
Webb et al. 2026 (I'm a co-author) proposes a consensus definition of what should count as a "rapid evidence assessment" (or REA) in conservation. It can be hard to find the sweet spot when assessing evidence. Too quick and dirty and you can get wrong answers, but too rigorous and the results 1) may come too late to be useful and 2) take a lot of resources that could be spent on multiple smaller studies. The paper has our final definition, recommended steps for a REA, and Table 1 has a nice little guide to picking what level of rigor may be the best fit in different circumstances.


REFERENCES:

Comte, L., Olden, J. D., Littlefield, C., Dickson, B. G., Zablocki, J., & Moryc, D. (2026). National assessment of river protection in the United States. Nature Sustainability. https://doi.org/10.1038/s41893-025-01693-8

Neugarten, R., Rodewald, A., Eklund, J., & O’Garra, T. (2025). An introduction to impact evaluation for conservation. Conservation Science and Practice, 7(11), 1–9. https://doi.org/10.1111/csp2.70169

Xiao, T., Nerini, F. F., Matthews, H. D., Tavoni, M., & You, F. (2025). Environmental impact and net-zero pathways for sustainable artificial intelligence servers in the USA. Nature Sustainability, 8(12), 1541–1553. https://doi.org/10.1038/s41893-025-01681-y

Webb, J. A., Schofield, K. A., Cook, C. N., Fisher, J. R. B., Cheng, S. H., Christie, A., Cooke, S. J., Dubois, N. S., Frampton, G., Macura, B., Nichols, S. J., Richards, R., Aicher, R. J., Mason, S., Anderson, E., Betley, E., Borsuk, M., Busch, J., Carlson, S., … Ridley, C. E. (2026). A Standardized Definition of Rapid Evidence Assessment for Environmental Applications. Conservation Letters, 19(1), 1–7. https://doi.org/10.1111/con4.70005


Sincerely,
 
Jon
 
p.s. This is a four pound turnip. I bought it at the farmer's market out of curiosity, and split it across two recipes and it was tasty!

Sunday, January 18, 2026

New paper - Rapid Evidence Assessments

A new paper I'm a co-author on just came out in Conservation Letters:

A Standardized Definition of Rapid Evidence Assessment for Environmental Applications

At it's heart, the paper proposes a consensus definition of what should count as a "rapid evidence assessment" (or REA) in conservation. It was hard to develop over several virtual workshops, because we had very different perspectives! The basic idea was that it can be hard to find the sweet spot when doing a literature review or evidence assessment. Too quick and dirty, and you can come to faulty conclusions by misunderstanding what evidence exists and what it says. But too complex and rigorous and the results may 1) come too late to be useful and 2) take a lot of resources that could be spent on multiple smaller studies.

For the few of us who work at conservation nonprofits, we saw systematic reviews as a typically unattainable gold standard, and we see a lot of informal "literature scans" when time is really scarce even though we know there are important limits and downsides. But for some of the academics, what looked very rigorous to the nonprofit scientists didn't look rigorous enough to count as a "rapid evidence assessment." For example, in one moment another participant suggested that surely we would all agree a literature review done via Google Scholar was impermissibly flawed and should be excluded. But almost all of my peer-reviewed publications had literature reviews done via Google Scholar! So in the end we settled on a definition where "rapid" is relative to systematic reviews.

The paper has our final definition, recommended steps for a REA, and Table 1 has a nice little guide to picking what level of rigor may be the best fit in different circumstances. Take a look!

https://conbio.onlinelibrary.wiley.com/doi/10.1111/con4.70005 

Thursday, January 2, 2025

Best of 2024 science summaries

Sarah and Jon before Christmas caroling

Happy New Year,


How better to celebrate the new year than with old science?!

As usual, here are my favorite 15 reruns (article summaries) from 2024, plus a few of my favorite bits about AI since I keep getting requests for more of that:

Upset at the articles I missed? Please email me your own favorites from 2024 and I'll do what I can to include them in upcoming summaries.

As always people can sign up to receive these summaries at http://bit.ly/sciencejon (no need to email me). On with the reruns!


CLIMATE CHANGE
OK, for years people have been hyping the potential of a kind of seaweed (Asparagopsis) to reduce methane emissions in cattle. But the in vitro evidence was mixed - with potential toxicity and downsides a concern if the dose wasn't just right. George et al 2024 is a live trial with good news! They found methane emissions from cattle given an Asparagopsis additive were cut roughly in half compared to control, with 6.6% higher weight gain per unit of feed and no substantial impacts on quality or health (fat color maybe a bit better, tenderness maybe a bit worse). The methane reduction peaked at day 21 and declined afterwards, but since most cattle are in feedlots only ~3 months (ranging from 1.5-4) the decline after day 100 is pretty moot. That's a lot of potential! The only potential downsides were ~50% higher bromine residues in kidney and muscle (I couldn't quickly find guidance on safe levels). Caveats: 1) there were no conflicts declared but the authors appear to almost all work as feedlot consultants and it's single rather than double-blinded, 2) in the US the feedlot phase is only about 15% of the lifecycle emissions of a cow (and of that, some is from growing crops and nitrous oxide) so TOTAL impact on CO2e / kg beef is not as dramatic. Overall my take is 1) this should absolutely be tested and replicated more - anything that reduces the very high carbon of beef is worth pursuing. BUT 2) if this is marketed as "green beef" or license to avoid reductions, it could be net harmful for the climate. and 3) IF spraying this solution on grass worked similarly and didn't inhibit development of calves, the impact could be much higher (since ~80%ish of a cow's life is grazing prior to feedlot, and methane emissions are higher on grass than feed). So let's test that too (note: there’s a new study claiming a ~1/3 reduction in methane during grazing via seaweed supplements that I haven’t reviewed yet). There's a blog about this at https://www.theguardian.com/australia-news/article/2024/aug/18/feeding-seaweed-supplement-to-cattle-halved-methane-emissions-in-australian-feedlot-study-finds

Trencher et al, 2024 is an analysis of the quality of carbon credits on the voluntary market. They focus on the 20 companies retiring the most credits between 2020-2023 (134 million metric tons CO2e), which is 20% of all global retirements on the three registries (see Fig 1 for company list). They found 87% of credits have a high risk of not providing real additional reductions (6% were low risk, most of the rest was medium), and 97% of credits focused on avoiding emissions rather than removal. Note that they classified all REDD+ (reducing deforestation and/or degradation) as high risk given that they have often 1) overestimated additionality, 2) not stopped deforestation, and/or 3) displaced deforestation elsewhere (aka 'leakage'). They also classify large-scale renewable energy as high-risk, since the price of credits is not typically the decisive factor in those projects (they are often built w/ or w/o credits) and they are often build in countries w strong government support for renewable energy. They also found that companies strongly prefer the cheapest credits (which creates demand for lower-quality offsets) often from older projects, although some companies have paid a lot more for REDD projects. The authors call for more regulation of the voluntary market, and for companies not using voluntary credits to support claims of offsetting emissions.

 
CONSERVATION IMPACT:
Langhammer et al. 2024 is the big splashy new Science paper looking at the global impact of conservation. It's a meta-analysis of trials comparing interventions to counterfactuals (similar areas w/o action). They found conservation helps 2/3 of the time (45% of trials led to absolute improvement in biodiversity, 21% reduced biodiversity loss), but is harmful 1/3 of the time (in 21% of trials biodiversity declined more due to conservation, in 12% it improved less due to conservation), and only 2% of trials showed no difference). That's not a great track record - I'd hoped net harm would be rare (1/3 is very high!), and just over half the time we're losing biodiversity despite trying to stop it. Fig 2 helpfully shows how impact varies by type of intervention: protected areas show the smallest positive effect on average, and invasive species removal shows the largest positive effect. I'd ignore "sustainable use of species" b/c it's a weirdly broad category that somehow only included 4 papers on wildlife hunting and 1 on fishing, although a few fishing papers are included under protected areas (details in the supplement - this makes me think their sample is not representative of conservation broadly). While the authors conclude conservation is working and we should do more of it, I bet if this was a paper on medical efficacy we'd consider interventions that are 2/3 helpful and 1/3 harmful an urgent cry to improve efficacy BEFORE we try to scale work that is so often ineffective or harmful. Would you send your kids to a school where 1/3 of students learned less than kids not in school at all?


EVIDENCE ASSESSMENTS / SCIENTIFIC REPRODUCIBILITY:
Scientists often complain policy makers don't follow our recommendations (or even read them). But Brisco et al. 2023 finds that recommendations from meta-analyses tend to change over time as research continues. They looked at 79 papers (121 meta-analyses) and found that over time 93% of analyses either had a big change in effect size (+- 50% or more, see Fig 2 for examples) or change in statistical significance (see Fig 3). The key results are in Fig 5, which I find pretty confusing. Results staying consistently statistically significant w/ each study is rare, and ~25% of analyses showed a reversal in effect (from positive to negative or vice versa). Those reversals are the change we care the most about since it means action can backfire. BUT if you ignore the studies that were never statistically significant (seems safe) it's only 12% of analyses that flip, and if you also ignore the ones that lost significance (meaning the reversal is less meaningful) it goes down to 11%. That's still pretty bad though - 1 time out of 9 the scientific recommendation might lead to the opposite outcome we intend. They recommend scientists use cumulative meta-analyses to look for trends, and the reminder that we're often wrong reinforces the need for adaptive management and an empirical approach to seeing what works in a given context.
 
 
FIRE:
Pivello et al. 2021 is a good comprehensive overview of wildfire across Brazil. It's long and dense so hard to summarize! Natural fires are most common at the beginning of the wet season when lightning ignites accumulated dry vegetation. Fig 1 has an overview of fire by biome: the Amazon followed by Cerrado have the most fires; the Pantanal and Cerrado typically have the highest % burned (they are both fire-dependent, as is the Pampas, see Fig 2), and in 2020 the Pantanal had roughly triple the % burned and fire density as others. Pollen evidence (from a different study, Power et al. 2016) indicates fire activity in the Pantanal peaked about 12,000 years ago (people have only lived there for about 8,000 years, and grazed cattle for ~250). Introducing cattle has caused a shift from burning every 3-6 years (mostly in the beginning or sometimes end of the wet season) to burning every year or two during a relatively dry part of the wet season (see Fig 6). Conversely, fire suppression in the Cerrado has also driven woody encroachment of savannas. In the Amazon and Atlantic Forest, natural fire is rare and very infrequent, making fire especially harmful as species are not adapted to it. The combination of deforestation and drought make it much easier for fire to spread (and Amazonian deforestation means more drought in the Pantanal). 1/3 of the forest in the Amazon from 2003-2019 were associated w/ deforestation. Indigenous people mostly used fires in small areas, but since European colonization it's used at larger scales to clear land permanently (or alternately suppressed, see Fig 7 for a nice timeline of fire landmarks). Integrated fire management (IFM) is uncommon (except a few federal protected areas, mostly in the Cerrado). Only Minas Gerais and Roraima states have IFM laws. The authors recommend: 1) fire management policy should include climate mitigation and poverty reduction to reduce fire risk; 2) better fire monitoring and management systems; 3) filling knowledge gaps around drivers of fire, how fire impacts wetlands, human dimensions of fire, impacts of different fire regimes on grazing productivity and carbon; 4) better enforcement of illegal fire use (including more resources); 5) including local communities in developing fire management plans, and 6) national and state level fire policies with adequate resources for implementation (including data collection and sharing, and clear and simple rules about fire use).
 
Balch et al. 2024 found that over the last 20 years fires in the US have been spreading faster. In the Western US over 20 years the average peak daily growth rate (the average of the fastest each fire grew on a given day) increased 2.5 times (in California they increased by 4 times). The fastest 3% of fires nationally (spreading more than 1,620 ha in a day) destroyed between 78-89% of the buildings lost to fire (the paper lists each number in different section for the same stat). I’ve heard a lot more about severity and frequency and extent of fire, but thinking about speed is also important as faster fires are harder to respond do, and may make really smooth coordination increasingly important. Increases in drought conditions and potential increases in high winds could make this worse over time. 


FRESHWATER:
Flitcroft et al. 2023 notes that counting effective freshwater protection globally is really hard (as is getting effective protection to happen). Fig 1 has a nice summary of how restrictive different protection mechanisms are. They also call for both better management of existing protected areas (PAs) to include freshwater conservation needs, and protections for freshwater in new places. While issues around data resolution and data availability continue to pose challenges to freshwater conservation, they argue that more explicit consideration of both freshwater and terrestrial objectives in any area-based protection is a good start.
 
Jasechko et al. 2024 is a global assessment of groundwater levels since 2000 (using 170,000 wells and 1,700 aquifers) and comparing them to earlier trends for ~1/3 of those aquifers. They found 36% of aquifers were drying up (water level dropping deeper by 0.1 m / yr or more), and 6% of aquifers were improving (water level rising 0.1 m / yr or more), w/ 58% of aquifers not changing quickly in this century. 30% of the aquifers where they had 40 years of data declined faster in the 21st century than the 20 years prior (see Fig 3), but in 49% of those aquifers declines slowed or reversed. Unsurprisingly the trend is worst in drylands w/ farmland, and groundwater deepening is globally correlated w/ low precipitation, high evapotranspiration, and extent of agriculture. See Fig 1 and 2 for global map of trends, highlighting hotspots of decline in CA, the US high plains, Iran, India, central Chile, and a few others. There's a news article about the study at https://www.cnn.com/2024/01/24/climate/groundwater-global-study-scn/index.html

Wang et al. 2024 looks at how climate change has changed the seasonality of river flow (how much it varies month to month, including frequency of droughts and floods). They found that ~14% of long-term river gauges show changes in seasonality over the last 50 years that isn't driven by changing annual precipitation. The surprise is that seasonality is mostly DECREASING counter to the narrative of more floods and droughts (see Fig 1 for a map of results, and Fig 2 which adds detail). In their figures brown means less seasonality (more even flow): "L+" means low flows become higher flows (NOT higher frequency of drought) while "H-" means floods see lower flood volume (again NOT lower frequency of flood events). You'll see most of North America, most of Europe, and some of Russia have seen reduced seasonality in recent decades. Blue means MORE seasonality, focused in: SE Brazil, some European countries, and in the US the SE and some of the Rocky Mountains. The explanation is worth reading in full, but in brief: 1) snow melting earlier means less runoff from snow at the same time as spring rains, 2) early spring greening means more water gets transpired, 3) it's more complicated in places not dominated by snowmelt.
 

HORIZON SCANNING / EMERGING ISSUES:
I realized I've only rarely reviewed Bill Sutherland's annual "horizon scan" article listing 15 emerging conservation issues that potentially deserve to be better-known. Last year (I just read the 2024 version a year late) they used artificial intelligence to generate some of the ideas but none made the cut. Here's the final list so you can decide if any are worth looking up (and here’s the brand new 2025 paper if you want to catch up):
1. New sources of hydrogen for energy (mining or electrolysis instead of natural gas),
2. Decarbonized ammonia (making fertilizer w/ lower carbon emissions but could increase fertilizer wasted),
3. Feeding people and/or animals w/ cultivated bacteria,
4. Light-free artificial photosynthesis (yes, it's as weird as it sounds) for indoor ag,
5. Enhanced rock weathering at scale (putting rock dust on croplands to sequester carbon),
6. Potential global declines in earthworm populations (more data is needed to see if UK decline is representative),
7. Ecoacoustics to monitor soil ecology (testing how meaningful soil sounds are for estimating things like biodiversity and water flow),
8. Wildfire affecting El Niño and La Niña phase (aerosols leading to the La Niña phase),
9. Benchtop DNA printers (potential to eventually allow guerilla genetic engineering),
10. Better predicting chemical toxicity from early data,
11. a skyscraper city planned in Saudi Arabia that birds could crash into when migrating from Europe to Africa.,
12. Sea urchin die-offs (possibly from disease) leading to algal overgrowth on corals and other marine ecosystems,
13. Ocean-based carbon removal (from the air or dissolved in water to stable forms),
14. Warming "twilight zones" (200-1000m below sea surface) affecting global nutrient and carbon cycles, and
15. Melting Antarctic ice changing deep sea currents.


MAMMALS:
Greenspoon et. al 2023 is an attempt to estimate the biomass of all wild mammals on earth (combined), arriving at 60 Mt total: 20 Mt (million metric tons) on land (half from "even-hoofed" mammals, see FIg 2), and 40 Mt in oceans (23 Mt of which comes from baleen whales). But the kicker is that they estimate human biomass at 390 Mt, and livestock biomass at 630 Mt (420 Mt from cattle: which is more than all humans plus all wild land mammals). Fig 4 awkwardly tries to compare all mammal biomass on earth, showing how wild species have been squeezed. The wild mammal estimates mostly come from the IUCN red list which skews towards expert assessments of more threatened spp., and the numbers won't be "right" for several reasons (these estimates are hard, and the data are highly limiting). But it seems solid that humans and livestock substantially outweigh wild mammals.
There's a good critique of the paper (arguing that Greenspoon et al. underestimate biomass by a factor of 5.5) by Santini et al. here https://www.pnas.org/doi/10.1073/pnas.2308958121 and a reply from the Greenspoon authors pointing out why the methods used in the critique are also (differently) flawed: https://www.pnas.org/doi/10.1073/pnas.2316314121
 

MIGRATORY SPECIES / WILDLIFE CONNECTIVITY:
The new State of the World's Migratory Species report (UNEP-WCMC 2024) has an update on how the 1,189 migratory species in CMS are doing. Almost half (44%) are in decline (with 22% at risk of extinction, including 97% of listed fish spp), 1/3 are stable, and the rest are split between improving and unknown. The report also notes that 399 spp not even listed in CMS (including ~200 fish spp, ~150 bird spp, and ) are at risk (from critically endangered to near threatened). See Fig 2.10b for an overview of which migratory species CMS leaves out (including horseshoe crabs!) and 2.10c for the subset at risk. Unsurprisingly the main threats are habitat loss (along w/ degradation and fragmentation) and overexploitation (hunting and fishing). Recommendations on page ix-xi are familiar and unsurprising (albeit important). There's a blog about this paper with key highlights at: https://www.unep.org/news-and-stories/press-release/landmark-un-report-worlds-migratory-species-animals-are-decline-and
 
Littlefield et al. 2024 (I'm a minor author) examines how wildlife road crossings can be beneficial to help species adapt to climate change. We recommend that when siting crossings we should consider a) current wildlife movements, AND expected short-term and long-term shifts in species range and migrations due to b) climate change AND c) human land use change (expansion of housing, ag, etc.). We show how doing this was accomplished for elk in Colorado.
For this to work well, diversion fencing is important to channel wildlife to crossings, and avoiding future fragmentation is key. The paper is open access. There's a press release for the paper here: https://fish.freeshell.org/publications/Littlefield2024-PressRelease.pdf


POLLINATORS:
Li et al. 2024 is a methods paper about using land cover data to predict floral resource availability for pollinators. I'm an author despite minimal input; the lead author based this on work by the last author, who I provided some guidance to when he was a postdoc. There are a few potentially interesting things in here. 1) Most pollinators don't make much honey, so their populations are limited by the time of year w/ the least food available (pollen and nectar). The methods here help you figure out those bottlenecks if you want to target habitat restoration to boost pollinator populations. 2) Plants vary a lot in how much nectar and pollen they make. Not every crop makes flowers that feed pollinators (likely obvious, but some crops and cover crops are harvested or terminated before flowering, and wind-pollinated plants don't have nectar). Trees produce a ton of nectar and pollen. 3) The paper looked at two different ways to map land cover, and surprisingly the simpler approach worked as well (similar error levels)! It's a good reminder to always question whether you need more complexity and accuracy. If you just have a garden and want more bees and other pollinators, this blog post I wrote may help: https://sciencejon.blogspot.com/2024/05/new-paper-on-mapping-pollinator.html
 

WETLANDS:
The latest report on the status of wetlands in the US (excluding AK and HI) is a bummer but has some useful info. Key summaries are in Fig 9 and Table 2, but in short on net 221,000 acres of wetlands were converted, mostly to ag and tree plantations followed by housing developments. But that net change hides that fact that we actually lost 670,000 acres of vegetated wetlands, with non-vegetated wetlands like ponds, sandbars, and mudflats increasing (but NOT providing nearly as much ecological value). The report calls for more coordination to achieve no net loss of wetlands, to update and improve the National Wetlands Inventory, develop and implement better wetland conservation and management (duh), and commit to long-term monitoring and adaptive management.


REFERENCES:

Balch, J. K., Iglesias, V., Mahood, A. L., Cook, M. C., Amaral, C., DeCastro, A., Leyk, S., McIntosh, T. L., Nagy, R. C., St. Denis, L., Tuff, T., Verleye, E., Williams, A. P., & Kolden, C. A. (2024). The fastest-growing and most destructive fires in the US (2001 to 2020). Science, 386(6720), 425–431. https://doi.org/10.1126/science.adk5737
 
Brisco, E., Kulinskaya, E., & Koricheva, J. (2023). Assessment of temporal instability in the applied ecology and conservation evidence base. Research Synthesis Methods, November, 1–15. https://doi.org/10.1002/jrsm.1691
 
Flitcroft, R. L., Abell, R., Harrison, I., Arismendi, I., & Penaluna, B. E. (2023). Making global targets local for freshwater protection. Nature Sustainability. https://doi.org/10.1038/s41893-023-01193-7
 
George, M. M., Platts, S. V., Berry, B. A., Miller, M. F., Carlock, A. M., Horton, T. M., & George, M. H. (2024). Effect of SeaFeed, a canola oil infused with Asparagopsis armata , on methane emissions, animal health, performance, and carcass characteristics of Angus feedlot cattle. Translational Animal Science, 8(August). https://doi.org/10.1093/tas/txae116
 
Greenspoon, L., Krieger, E., Sender, R., Rosenberg, Y., Bar-On, Y. M., Moran, U., Antman, T., Meiri, S., Roll, U., Noor, E., & Milo, R. (2023). The global biomass of wild mammals. Proceedings of the National Academy of Sciences, 120(10), 2017. https://doi.org/10.1073/pnas.2204892120

REPLY AND COUNTER-REPLY TO GREENSPOON:

  • Santini, L., Berzaghi, F., & Benítez-López, A. (2024). Total population reports are ill-suited for global biomass estimation of wild animals. Proceedings of the National Academy of Sciences, 121(4), 1–3. https://doi.org/10.1073/pnas.2308958121   
  • Greenspoon, L., Rosenberg, Y., Meiri, S., Roll, U., Noor, E., & Milo, R. (2024). Reply to Santini et al.: Total population reports are necessary for global biomass estimation of wild mammals. Proceedings of the National Academy of Sciences of the United States of America, 121(4), 1–2. https://doi.org/10.1073/pnas.2316314121

Jasechko, S., Seybold, H., Perrone, D., Fan, Y., Shamsudduha, M., Taylor, R. G., Fallatah, O., & Kirchner, J. W. (2024). Rapid groundwater decline and some cases of recovery in aquifers globally. Nature, 625(7996), 715–721. https://doi.org/10.1038/s41586-023-06879-8
 
Lang, M. W., Ingebritsen, J. C., & Griffin, R. K. (2024). Status and Trends of Wetlands in the Conterminous United States 2009 to 2019. U.S. Department of the Interior; Fish and Wildlife Service, Washington, D.C. 43 pp. https://www.fws.gov/project/2019-wetlands-status-and-trends-report

Langhammer, P. F., Bull, J. W., Bicknell, J. E., Oakley, J. L., Brown, M. H., Bruford, M. W., Butchart, S. H. M., Carr, J. A., Church, D., Cooney, R., Cutajar, S., Foden, W., Foster, M. N., Gascon, C., Geldmann, J., Genovesi, P., Hoffmann, M., Howard-McCombe, J., Lewis, T., … Brooks, T. M. (2024). The positive impact of conservation action. Science, 384(6694), 453–458. https://doi.org/10.1126/science.adj6598

Li, K., Fisher, J., Power, A., & Iverson, A. (2024). A map of pollinator floral resource habitats in the agricultural landscape of Central New York. One Ecosystem, 9. https://doi.org/10.3897/oneeco.9.e118634
 
Littlefield, C. E., Suraci, J. P., Kintsch, J., Callahan, R., Cramer, P., Cross, M. S., Dickson, B. G., Duncan, L. A., Fisher, J. R., Freeman, P. T., Seidler, R., Wearn, A., Andrews, K. M., Brocki, M., Dodd, N., Gagnon, J., Johnson, A., Krosby, M., Skroch, M., & Sutherland, R. (2024). Evaluating and elevating the role of wildlife road crossings in climate adaptation. Frontiers in Ecology and the Environment, 1–10. https://doi.org/10.1002/fee.2816
 
Pivello, V. R., Vieira, I., Christianini, A. V., Ribeiro, D. B., da Silva Menezes, L., Berlinck, C. N., Melo, F. P. L., Marengo, J. A., Tornquist, C. G., Tomas, W. M., & Overbeck, G. E. (2021). Understanding Brazil’s catastrophic fires: Causes, consequences and policy needed to prevent future tragedies. Perspectives in Ecology and Conservation, 19(3), 233–255. https://doi.org/10.1016/j.pecon.2021.06.005
 
Sutherland, W. J., Bennett, C., Brotherton, P. N. M., Butchart, S. H. M., Butterworth, H. M., Clarke, S. J., Esmail, N., Fleishman, E., Gaston, K. J., Herbert-Read, J. E., Hughes, A. C., James, J., Kaartokallio, H., Le Roux, X., Lickorish, F. A., Newport, S., Palardy, J. E., Pearce-Higgins, J. W., Peck, L. S., … Thornton, A. (2024). A horizon scan of global biological conservation issues for 2024. Trends in Ecology & Evolution, 39(1), 89–100. https://doi.org/10.1016/j.tree.2023.11.001
 
Trencher, G., Nick, S., Carlson, J., & Johnson, M. (2024). Demand for low-quality offsets by major companies undermines climate integrity of the voluntary carbon market. Nature Communications, 15(1), 6863. https://doi.org/10.1038/s41467-024-51151-w
 
UNEP-WCMC, 2024. State of the World’s Migratory Species. UNEP-WCMC, Cambridge, United Kingdom.
https://www.cms.int/en/publication/state-worlds-migratory-species-report
 
Wang, H., Liu, J., Klaar, M., Chen, A., Gudmundsson, L., & Holden, J. (2024). Anthropogenic climate change has influenced global river flow seasonality. Science, 383(6686), 1009–1014. https://doi.org/10.1126/science.adi9501


Sincerely,
 
Jon
 
p.s. I inherited that Christmas sweater from my dad, and typically only pull it out once a year for a Christmas sing-along

Thursday, August 1, 2024

August Science Summary (fire in the Pantanal)

Sunset over cape may national wildlife refuge
Hi,

This month I'm focusing on a single issue (fire in the Pantanal) but also advertising a new preprint I'm an author on. Fires in the Pantanal this June broke the record for that month (we have records of about 20 years) so it seemed timely!

If you know someone who wants to sign up to receive these summaries, they can do so at http://bit.ly/sciencejon (no need to email me). Unsubscribe via the link at the end.


RAPID EVIDENCE ASSESSMENTS (REA):
I'm an author on a new preprint (not yet peer-reviewed) about rapidly assessing evidence in conservation (Schofield et al. 202X). It's the conclusions of a working group hosted by EPA which met over several online workshops to try and build consensus for a definition and approach since there are many competing ones out there. "Rapid" in this case is relative to systematic reviews - it doesn't mean doing the kind of informal scan of science literature that is pretty common at NGOs. We argue that it's important to balance speed w/ rigor to avoid either wasting effort on unnecessary detail or arriving at the wrong answer by rushing. The definition kind of hits the high points of the topics the paper covers: "REA is a structured review process that aims to maximize rigor and objectivity given assessment needs and resource constraints (e.g., time). REA aims to address requirements for timely and cost-efficient decision-making while maintaining confidence in conclusions. REA is typically more rigorous than less formalized practices such as traditional narrative literature reviews, but effort is reduced relative to comprehensive evidence assessment approaches such as systematic review. REA is transparent, well-documented, and the details of the specific methods used at each step are justified. Those who commission, conduct, and use REAs should be cognizant of the achievable levels of confidence in the conclusions that accompany the rapid application of different steps in the REA process." Let me know if you have questions, criticisms, ideas, etc. https://osf.io/u7z2g


FIRE IN THE PANTANAL:
Damasceno-Junior et al. 2023 covers flood and fire dynamics in the Pantanal and the need for integrated fire management (IFM), using the 2020 wildfires as a case study. The Pantanal burns the most in the dry season (Aug-Oct, Fig 5). From 2003-2019, ~5-15% of the biome burned each year (Fig 7); roughly half never burned and of the areas that did almost all burned no more than 4 times over 16 years (Fig 6In 2020 about 30% burned! It was a very dry year (the bottom ~5% over the last 120 years, and the worst in 47 years), but not the dryest on record (Fig 3). The drought allowed the fire to spread via soil as well as above ground. The authors believe that despite being the most severe fire on record, similar fires likely happened in past droughts. Note that cattle can both drive wildfire (by setting fires to clear vegetation) and reduce it (by reducing biomass available to burn). Key recommendations include: 1) better integration of information and decision makers (including between Mato Grosso and Mato Grosso do Sul; they worked together but not enough), 2) mobilization of additional people (federal natural resource staff, local police and firefighters, private fire brigades, NGOs, volunteers, etc.), 3) inclusion of Pantanal residents w/ traditional knowledge, 4) more research on the interaction of fire and floods in the Pantanal, 5) better fire forecasting and better communication about those risks (including to land managers who set fires).

Garcia et al. 2021 is an overview of fire in the Pantanal, and a call for an integrated fire management (IFM) program in the Pantanal. Water moves slowly through the Pantanal; it takes 3 months for rainfall in the watershed to reach the southern Pantanal via the Paraguay river. This means that near Corumbá typically there is flooding during the dry season (preventing fires in the floodplain), and water levels are lowest in December (after the rainy season has begun). But the 2020 wet season had 60% less rain than normal. That meant dead vegetation from 2019's flood combined w/ a lack of flooding provides fuel for wildfires. 43% of the area that burned in 2020 hadn't burned before since records began in 2003 (areas in gray in Fig 1). They noted that fire management in 2020 was hampered by COVID-19 (fewer firefighters were available, and had to socially distance from each other). Climate change is expected to bring more drought years, exacerbated by deforestation in the neighboring Amazon and Cerrado. The authors call for removing invasive African grasses (like Urochloa / Brachiaria) and note a 2021 IFM plan actually incentivizes planting cultivated grass. They also recommend more prescribed burns in the wet season, safe fire training for ranch workers, more funding for fire prevention, better warning systems, and increasing the participation of Indigenous people in fire brigades.

Pivello et al. 2021 is a good comprehensive overview of wildfire across Brazil. It's long and dense so hard to summarize! Natural fires are most common at the beginning of the wet season when lightning ignites accumulated dry vegetation. Fig 1 has an overview of fire by biome: the Amazon followed by Cerrado have the most fires; the Pantanal and Cerrado typically have the highest % burned (they are both fire-dependent, as is the Pampas, see Fig 2), and in 2020 the Pantanal had roughly triple the % burned and fire density as others. Pollen evidence (from a different study, Power et al. 2016) indicates fire activity in the Pantanal peaked about 12,000 years ago (people have only lived there for about 8,000 years, and grazed cattle for ~250). Introducing cattle has caused a shift from burning every 3-6 years (mostly in the beginning or sometimes end of the wet season) to burning every year or two during a relatively dry part of the wet season (see Fig 6). Conversely, fire suppresion in the Cerrado has also driven woody encroachment of savannas. In the Amazon and Atlantic Forest, natural fire is rare and very infrequent, making fire especially harmful as species are not adapted to it. The combination of deforestation and drought make it much easier for fire to spread (and Amazonian deforestation means more drought in the Pantanal). 1/3 of the forest in the Amazon from 2003-2019 were associated w/ deforestation. Indigenous people mostly used fires in small areas, but since European colonization it's used at larger scales to clear land permanently (or alternately supressed, see Fig 7 for a nice timeline of fire landmarks). Integrated fire management (IFM) is uncommon (except a few federal protected areas, mostly in the Cerrado). Only Minas Gerais and Roraima states have IFM laws. The authors recommend: 1) fire management policy should include climate mitigation and poverty reduction to reduce fire risk; 2) better fire monitoring and management systems; 3) filling knowledge gaps around drivers of fire, how fire impacts wetlands, human dimensions of fire, impacts of different fire regimes on grazing productivity and carbon; 4) better enforcement of illegal fire use (including more resources); 5) including local communities in developing fire management plans, and 6) national and state level fire policies with adequate resources for implementation (including data collection and sharing, and clear and simple rules about fire use).

Oliveira et al. 2021 looks at the impact of Indigenous fire brigades in the Kadiwéu Indigenous territory (where the Cerrado meets the Pantanal). They compared 2001-2008 (no Indigenous fire brigades) to years when they were active (2009-2018; the first 5 years they tried to suppress all fires and the last 5 they used integrated fire management). While a before/after study isn't a true control, the years w/ the fire brigades had 53% less area burned, the area that burned often (70% of the years in each period) declined by 84%, and areas with no fire increased by 86% (note the % reported in the text doesn't match the number of acres, I'm using the latter). Interestingly the number of days without rain affected the area burned w/o the brigades, but when the brigades were active climatic factors had much less influence. The authors note that the reduced fire frequency allowed forests to expand and grasslands to shrink; it wasn't clear which was their more natural historic state.

Arrua et al. 2023 asked how fire frequency and severity affected sun spiders in the Kadiwéu Indigenous Reserve. They considered fire every 1-2 years frequent, w/ every 3-4 years infrequent. Spider abundance was not significantly affected by fire frequency or timing, but the most spiders were seen 1 month after a fire (perhaps b/c of bugs that like young leaves eating the new shoots).

dos Santos Ferreira et al. 2023 found that patchy and variable fire regimes (but avoiding high fire frequency from July to December) leads to flowers and fruits being continuously available in the Kadiwéu Indigenous territory . They recommend a seasonal patch-burning mosaic without trying explicit to optimize flower and fruit production.


REFERENCES:
Arrua, B. A., Carvalho, L. S., Teles, T. S., Oliveira, M. da R., & Ribeiro, D. B. (2023). Fire Has a Positive Effect on the Abundance of Sun Spiders (Arachnida: Solifugae) in the Cerrado-Pantanal Ecotone. Fire, 6(2), 1–12. https://doi.org/10.3390/fire6020069

Damasceno-Junior, G. A., Roque, F. de O., Garcia, L. C., Ribeiro, D. B., Tomas, W. M., Scremin-Dias, E., Dias, F. A., Libonati, R., Rodrigues, J. A., Lemos, F., Santos, M., Pereira, A. de M. M., de Souza, E. B., Reis, L. K., da Rosa Oliveira, M., Souza, A. H. de A., Manrique-Pineda, D. A., Ferreira, B. H. dos S., Bortolotto, I. M., & Pott, A. (2021). Wetland Science. In B. A. K. Prusty, R. Chandra, & P. A. Azeez (Eds.), Wetland Science & Practice (Vol. 38, Issue 2). Springer India. https://doi.org/10.1007/978-81-322-3715-0

dos Santos Ferreira, B. H., da Rosa Oliveira, M., Mariano Fernandes, R. A., Fujizawa Nacagava, V. A., Arguelho, B. A., Ribeiro, D. B., Pott, A., Damasceno Junior, G. A., & Garcia, L. C. (2023). Flowering and fruiting show phenological complementarity in both trees and non-trees in mosaic-burnt floodable savanna. Journal of Environmental Management, 337(February), 117665. https://doi.org/10.1016/j.jenvman.2023.117665

Garcia, L. C., Szabo, J. K., de Oliveira Roque, F., de Matos Martins Pereira, A., Nunes da Cunha, C., Damasceno-Júnior, G. A., Morato, R. G., Tomas, W. M., Libonati, R., & Ribeiro, D. B. (2021). Record-breaking wildfires in the world’s largest continuous tropical wetland: Integrative fire management is urgently needed for both biodiversity and humans. Journal of Environmental Management, 293(April), 112870. https://doi.org/10.1016/j.jenvman.2021.112870

Oliveira, M. R., Ferreira, B. H. S., Souza, E. B., Lopes, A. A., Bolzan, F. P., Roque, F. O., Pott, A., Pereira, A. M. M., Garcia, L. C., Damasceno, G. A., Costa, A., Rocha, M., Xavier, S., Ferraz, R. A., & Ribeiro, D. B. (2022). Indigenous brigades change the spatial patterns of wildfires, and the influence of climate on fire regimes. Journal of Applied Ecology, 59(5), 1279–1290. https://doi.org/10.1111/1365-2664.14139

Pivello, V. R., Vieira, I., Christianini, A. V., Ribeiro, D. B., da Silva Menezes, L., Berlinck, C. N., Melo, F. P. L., Marengo, J. A., Tornquist, C. G., Tomas, W. M., & Overbeck, G. E. (2021). Understanding Brazil’s catastrophic fires: Causes, consequences and policy needed to prevent future tragedies. Perspectives in Ecology and Conservation, 19(3), 233–255. https://doi.org/10.1016/j.pecon.2021.06.005

Power, M. J., Whitney, B. S., Mayle, F. E., Neves, D. M., de Boer, E. J., & Maclean, K. S. (2016). Fire, climate and vegetation linkages in the bolivian chiquitano seasonally dry tropical forest. Philosophical Transactions of the Royal Society B: Biological Sciences, 371(1696). https://doi.org/10.1098/rstb.2015.0165


Sincerely,
 
Jon
 
p.s. The picture above is a sunset at Cape May National Wildlife Refuge

Friday, March 1, 2024

March 2024 science summary

Shift

Howdy,


This month I have two articles on wildlife connectivity, one on global groundwater depletion, one on scientific reproducibility, and one on organizational behavior change.

If you know someone who wants to sign up to receive these summaries, they can do so at http://bit.ly/sciencejon (no need to email me).

SCIENTIFIC REPRODUCIBILITY / EVIDENCE ASSESSMENTS:
Scientists often complain policy makers don't follow our recommendations (or even read them). But Brisco et al. 2023 finds that recommendations from meta-analyses tend to change over time as research continues. They looked at 79 papers (121 meta-analyses) and found that over time 93% of analyses either had a big change in effect size (+- 50% or more, see Fig 2 for examples) or change in statistical significance (see Fig 3). The key results are in Fig 5, which I find pretty confusing. Results staying consistently statistically significant w/ each study is rare, and ~25% of analyses showed a reversal in effect (from positive to negative or vice versa). Those reversals are the change we care the most about since it means action can backfire. BUT if you ignore the studies that were never statistically significant (seems safe) it's only 12% of analyses that flip, and if you also ignore the ones that lost significance (meaning the reversal is less meaningful) it goes down to 11%. That's still pretty bad though - 1 time out of 9 the scientific recommendation might lead to the opposite outcome we intend. They recommend scientists use cumulative meta-analyses to look for trends, and the reminder that we're often wrong reinforces the need for adaptive management and an empirical approach to seeing what works in a given context.


FRESHWATER / GROUNDWATER:
Jasechko et al. 2024 is a global assessment of groundwater levels since 2000 (using 170,000 wells and 1,700 aquifers) and comparing them to earlier trends for ~1/3 of those aquifers. They found 36% of aquifers were drying up (water level dropping deeper by 0.1 m / yr or more), and 6% of aquifers were improving (water level rising 0.1 m / yr or more), w/ 58% of aquifers not changing quickly in this century. 30% of the aquifers where they had 40 years of data declined faster in the 21st century than the 20 years prior (see Fig 3), but in 49% of those aquifers declines slowed or reversed. Unsurprisingly the trend is worst in drylands w/ farmland, and groundwater deepening is globally correlated w/ low precipitation, high evapotranspiration, and extent of agriculture. See Fig 1 and 2 for global map of trends, highlighting hotpsots of decline in CA, the US high plains, Iran, India, central Chile, and a few others. There's a news article about the study at https://www.cnn.com/2024/01/24/climate/groundwater-global-study-scn/index.html


WILDLIFE CONNECTIVITY:
Iverson et al. 2024 cautions against assuming that modeled wildlife corridors connecting habitat patches ('linkages') actually receive much heavier use by wildlife. They looked at five linkage models in CA (see Fig 1), and compared them to 1) wildlife-vehicle collisions and 2) modeled wildlife presence (from a large set of wildlife observations). While black bear and puma vehicle collisions were slightly more likely in linkages, racoon collisions were LESS likely in linkages, and the other five species assessed were mixed depending on model. Across all eight species no model did consistently well for either wildlife vehicle collisions nor modeled occupancy. The authors note that the linkage models were all built on human disturbance metrics, but that another study found those metrics only significantly drove away about 1/3 of mammal species studied (including big carnivores and omnivores). Since wildlife don't have apps to find optimal travel routes, it's not shocking that they're not heavily using linkages. But this study is a good reminder to be wary of relying on models for citing narrow corridors, and it's a safer bet to assume wildlife presence is not typically highly concentrated.

Thurman et al. 2024 argues that it's important to consider disease when doing conservation planning and wildlife management. One key point is that in some cases improving connectivity can be net harmful for some species. The case of prairie dogs and black-footed ferrets on the top of page 3 is fairly compelling (the impact of plague is high enough that mitigating its spread should be a priority). Overall, I think it's fair to say that species and ecosystems need climate-resilient connectivity options to adapt to climate change, even if increased disease transmission offsets the benefits somewhat. But thinking about disease and if/how to incorporate it in planning should always be a good idea. I like the orange questions in Figure 1, but found the longer list in Table 1 to be overwhelming (which could make it harder for planners to act). There's no silver bullet being offered here, but maybe they're warning us to watch out for 'friendly fire' (unintended negative impacts of promoting connectivity w/o thinking about disease).


ORGANIZATIONAL BEHAVIOR CHANGE:
Ferraro et al. 2019 is a non-peer-reviewed working paper that asks whether behavioral psychology nudges known to influence individuals work on organizations too. They looked at a national organization asking for voluntary membership does from 3,000 nonprofits, and tested 1) crafting a clear and salient ask to emphasize public benefits, 2) publicly sharing who contributed and by how much, and 3) showing quarterly progress towards a national goal. All had no effect (each treatment on average made contributions very slightly lower, but w/o statistical significance). The authors hypothesize (w/ evidence from other studies) that group decision making makes orgs less responsive than individuals to these kinds of interventions. An interesting follow-up study would be to target individuals with the individual authority to make decisions that affect the broader organization and see if that works.


REFERENCES:

Brisco, E., Kulinskaya, E., & Koricheva, J. (2023). Assessment of temporal instability in the applied ecology and conservation evidence base. Research Synthesis Methods, November, 1–15. https://doi.org/10.1002/jrsm.1691

Ferraro, P. J., Weigel, C., An, J., & MESSER, K. D. (2019). Nudging Organizations: Evidence from three large-scale field experiments (Vol. 21211). https://doi.org/10.1257/rct.4238-3.0

Iverson, A. R., Waetjen, D., & Shilling, F. (2024). Functional landscape connectivity for a select few: Linkages do not consistently predict wildlife movement or occupancy. Landscape and Urban Planning, 243(March 2023), 1–12. https://doi.org/10.1016/j.landurbplan.2023.104953

Jasechko, S., Seybold, H., Perrone, D., Fan, Y., Shamsudduha, M., Taylor, R. G., Fallatah, O., & Kirchner, J. W. (2024). Rapid groundwater decline and some cases of recovery in aquifers globally. Nature, 625(7996), 715–721. https://doi.org/10.1038/s41586-023-06879-8

Thurman, L. L., Alger, K., LeDee, O., Thompson, L. M., Hofmeister, E., Hudson, J. M., Martin, A. M., Melvin, T. A., Olson, S. H., Pruvot, M., Rohr, J. R., Szymanksi, J. A., Aleuy, O. A., & Zuckerberg, B. (2024). Disease‐smart climate adaptation for wildlife management and conservation. Frontiers in Ecology and the Environment, 1–10. https://doi.org/10.1002/fee.2716


Sincerely,
 
Jon
 
p.s. The photo is of a piece called "Shift" by Lisa Wood Studios, and it cycled between saying "Unconscious consumption" and "Conscious conservation" (presumably what we have now) and then as shown above "conscious consumption" and "unconscious conservation" (which makes less sense to me, but presumably means we're mindful of our choices and conservation happens automatically?

Monday, December 3, 2018

December 2018 science journal article summary

Cool insect eggs (Harlequin bug)

Greetings,

Here are some articles focused on pest control (the photo above is of harlequin bug eggs on kale), food safety, climate change, evidence, and even beer! Let me know if you need a copy of any of them. If you know someone who wants to sign up to receive these summaries, they can do so at http://bit.ly/sciencejon


CLIMATE CHANGE / NATURAL CLIMATE SOLUTIONS:
Almost everyone who works for or closely with The Nature Conservancy heard about the 2017 "Natural Climate Solutions" paper (Griscom et al. 2017, I reviewed it in November 2017). If you've been waiting for the sequel - good news! Fargione et al. 2018 just provided a similar analysis specifically for the United States. It's short, excellent, and worth reading, but if you're impatient skip to Figure 1. That summarizes the potential of each pathway and splits out how much is achievable at different carbon prices. They found a maximum potential of 1.2 Pg (aka 1200 million metric tons) CO2e / yr (21% of current US emissions and ~27% of 2005 emissions), and ~300 Tg (million metric tons) achievable at $10 / t CO2e (~5% of US emissions). The biggest low cost opportunities are in planting cover crops followed by forest management, avoided habitat conversion, and improved farm nutrient management. You can read more about it on TNC's web site at https://www.nature.org/en-us/explore/newsroom/natural-climate-solutions-study/ or at https://eurekalert.org/pub_releases/2018-11/cu-nsr111418.php

ORGANIC AGRICULTURE / FOOD SAFETY:
This is an interesting study on how consumption of organic vs. conventional foods affects cancer risk. They did find the people who ate the most organic food had 24% less cancer compared to the people who ate the least (even after controlling for quite a few lifestyle and diet variables, see Model 3 in Table 2). Unfortunately, they didn't test for pesticide residue (to confirm the hypothesis that pesticide was driving these results), there was a short follow-up time, they used a single unvalidated diet assessment, and there are enough odd findings (e.g. finding processed meat intake doesn't intake cancer risk) to make me suspect they didn't discover a causative relationship. I also don't understand how their model could find the organic diet has such a strong impact on cancer but then find that people eating a high quality diet AND lots of organic food didn't have reduced risk relative to those eating a low quality diet and little organic food (and supplemental table 6 looks like there IS a reduced risk although perhaps the confidence interval is too high to state it definitively). In short, this was an interesting paper but I don't think it is strong evidence for the conclusions they present. You can read a blog about this one at https://www.nytimes.com/2018/10/23/well/eat/can-eating-organic-food-lower-your-cancer-risk.html


EVIDENCE & DECISION MAKING:
To be effective in conservation, we need reliable evidence about the impact of different actions and strategies. This lets us focus on the strategies that will best help us reach our goals. Game et al. 2018 (led by TNC's Eddie Game) has timely guidance for how scientists should assess the quality of evidence (across multiple disciplines). They recommend beginning with a results chain to map out causal associations between actions, intermediate results, and outcomes, and then looking for the evidence of each link. They also note that in conservation a broader approach is needed than in other disciplines like medicine. The key point is the set of four principles they use to assess the strength of evidence. They are: variety (multiple types of evidence available), consistency (the evidence has consistent findings), credibility (the evidence comes from trusted sources), and applicability (the evidence matches the context of the issue being evaluated). You can read a blog about the paper at https://sustainabilitycommunity.nature.com/channels/1385-behind-the-paper/posts/38893-required-rethink-on-what-is-evidence

Bennett et al. 2018 is an attempt to make value of information (VOI) theory more practical. While still theoretical, they show how to apply VOI theory across multiple "management units." In each unit, the model compares two choices: acting with existing imperfect information, or doing more monitoring to support decision making. The revised model is a step forward, and I also enjoyed the discussion of limitations. For example, they mention that their model is risk neutral, which is often not the case with real decision makers.


CLIMATE CHANGE & BEER:
As we approach a major holiday season in the U.S., many people celebrate with alcohol. Xie et al. 2018 has a dire warning from the ghost of Christmas future: climate change may reduce barley yields (3-17%) and beer supply while driving up prices. Essentially they predict worsening drought and extreme heat will reduce barley production, and that during extreme years barley for beer will be reduced in favor of livestock feed and direct consumption. See Figure 3 for a nice summary of patterns of barley use by country now and under climate change. Some important limits: they don't predict future demand for beer (likely to increase), and they don't look at adaptation (e.g. making more beer w/ rice and corn as some major brewers do already, improved seed genetics, etc.). These caveats reinforce my skepticism of some predictions such as the price of beer in Ireland almost doubling (it's hard to imagine that could happen without a strong adaptive response). Nonetheless, most science predicting future food demand and supply focuses more on staples than luxuries, and this is an interesting twist.


REFERENCES:
Baudry, J., Ke, A., Touvier, M., Allès, B., Seconda, L., Latino-Martel, P., … Kesse-Guyot, E. (2018). Association of Frequency of Organic Food Consumption with Cancer Risk: Findings From the NutriNet-Santé Prospective Cohort Study. JAMA Internal Medicine. https://doi.org/10.1001/jamainternmed.2018.4357

Bennett, J. R., Maxwell, S. L., Martin, A. E., Chadès, I., Fahrig, L., & Gilbert, B. (2018). When to monitor and when to act: Value of information theory for multiple management units and limited budgets. Journal of Applied Ecology, 55(January), 2102–2113. https://doi.org/10.1111/1365-2664.13132

Deutsch, C. A., Tewksbury, J. J., Tigchelaar, M., Battisti, D. S., Merrill, S. C., Huey, R. B., & Naylor, R. L. (2018). Increase in crop losses to insect pests in a warming climate Downloaded from. Science, 361(August), 31. https://doi.org/10.1126/science.aat3466

Fargione, J. E., Bassett, S., Boucher, T., Bridgham, S. D., Conant, R. T., Cook-patton, S. C., … Griscom, B. W. (2018). Natural climate solutions for the United States. Science Advances, 4(November).

Game, E. T., Tallis, H., Olander, L., Alexander, S. M., Busch, J., Cartwright, N., … Sutherland, W. J. (2018). Cross-discipline evidence principles for sustainability policy. Nature Sustainability, 1(9), 452–454. https://doi.org/10.1038/s41893-018-0141-x

Karp, D. S., Chaplin-Kramer, R., Meehan, T., Martin, E., DeClerck, F., Grab, H., … Zou, Y. (2018). Crop pests and predators exhibit inconsistent responses to surrounding landscape composition. Proceedings of the National Academy of Sciences of the United States of America. https://doi.org/10.1073/pnas.1800042115

Waterfield, G., & Zilberman, D. (2012). Pest Management in Food Systems: An Economic Perspective. Annual Review of Environment and Resources, 37, 223–247. https://doi.org/10.1146/annurev-environ-040911-105628

Xie, W., Xiong, W., Pan, J., Ali, T., Cui, Q., Guan, D., … Davis, S. J. (2018). Decreases in global beer supply due to extreme drought and heat. Nature Plants. https://doi.org/10.1038/s41477-018-0263-1


Sincerely,

Jon

p.s. as a reminder, you can search all of the science articles written by TNC staff (that we know of) here http://www.conservationgateway.org/ConservationPlanning/ToolsData/sitepages/article-list.aspx
(as you publish please email science_pubs@tnc.org to help keep this resource current).
If you'd like to keep track of what I write as well as what I read, I always link to both my informal blog posts and my formal publications (plus these summaries) at http://sciencejon.blogspot.com/

Wednesday, January 3, 2018

Take 2: what I wish I'd put in my recent book chapter

I asked my wife Sarah to take a look at my recent chapter in the book "Effective Conservation Science: Data Not Dogma" and she made an excellent point: what should the take-away be? Here are the things I was hoping to convey but wasn't sufficiently clear about.

The key fact I wanted to convey is that the global agriculture situation is complex: the global land used for agriculture hit its peak in 1998 (so it's not true agricultural land is rapidly expanding around the world), BUT in some places there is a lot of agricultural expansion and/or reliance on unsustainable levels of water and nutrients. So there is good news and bad news.

Some other important facts I didn't go into in much detail:
  • In the last two decades we have been able to meet increasing demand for food through intensification (producing more food on existing lands). But going forward projected demand rises faster than what we're likely to be able to produce through intensification. So between 2030-2050 we can expect conversion to agriculture to speed up and lead to a net expansion of land used for agriculture.
  • Agriculture in many regions currently relies on unsustainable irrigation. As groundwater is depleted and crops get thirsty we can expect yields to eventually fall substantially on agricultural lands in water-scarce areas. The California drought gives us a taste of what that could look like. Note that changes in irrigation technology are likely insufficient to solve this on their own (see the summary of Richter 2017).
  • Other agricultural inputs may start to run out or at least limit improved crop yields. That could include rock phosphate for fertilizer or even nitrogen fertilizer if actions to limit climate change make it more expensive.
The key message of the piece for other scientists is: don't assume that things that seem obvious (like ag land rapidly expanding) are true, and don't assume that global data sets are reliable enough to inform policy or other action. Dig deeper! Ask questions, and look for more local data to corroborate your suspicions.

Let me know if you have other questions or suggestions!

Wednesday, October 18, 2017

New book: "Effective Conservation Science: Data not Dogma"

I have a chapter in a new book that was just published:
Effective Conservation Science: Data not Dogma (click the link to read more and buy it if you like).

The book has a really cool theme: what happens when we find evidence that contradicts what "everyone knows"? How do people react, and how do we resolve the disconnect?

In my case, while doing research for another book, I discovered that global land used for agriculture had actually been declining since 1998, despite the narrative that ag was rapidly expanding around the world.

I got a lot of pushback when I blogged about it a few years ago, and this chapter tells the story of what I found, what the reaction was, and what it all means going forward.

I really think the book is a great read based on the several chapters I've read so far, so if you're interested I encourage you to buy it. If you're not sure, you can read a review of a different chapter, or read the ugly (unformatted) version of my chapter here: Global agricultural expansion: the sky isn't falling (yet), and read another blog I wrote on the chapter with better framing and explanation here: Take 2: what I wish I'd put in my recent book chapter

Here's a map showing where around the world agriculture IS expanding, and where it's contracting:

Sunday, October 1, 2017

October science journal article summary

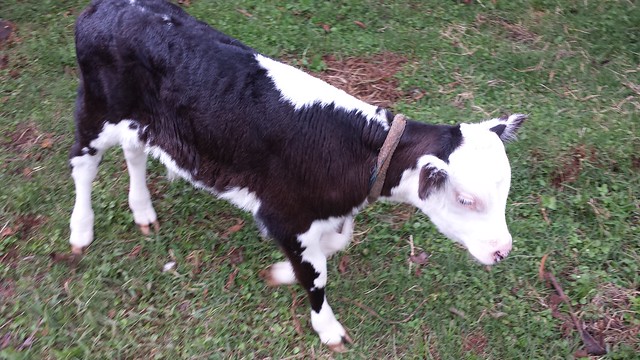
Calf

Here's some science to make your October outstanding! I have a 3-question survey about these summaries that should take a minute or less to answer; please consider taking it (or emailing me if you prefer). I'm trying to get a sense of how often people read them, whether the level of detail is right or not, and get any other feedback people have: https://www.surveymonkey.com/r/BCVDKQR


The focus of this review is on reducing the impacts of animal agriculture (especially cattle). For anyone who missed my June 2016 review, I'll re-recommend Herrero et al 2016 as a fantastic overview of the potential for improving GHG emissions in the livestock sector. Their top picks were improved feed digestibility (including more cereals, distiller's grains, etc. to supplement or replace grass and hay), feed additives, avoiding land use change through intensification, and carbon sequestration from better grazing.


ANIMAL AGRICULTURE:
There a lot of discussion on how to shrink the high carbon footprint of cattle (beef and dairy), and one focal area is on enteric methane (mainly cow burps). Hristov et al 2015 is a study showing that a feed additive (3NOP) was able to reduce dairy methane production by ~30% (with oddly similar impact regardless of the dose) without substantially affecting milk yield (although it increased weight gain by 80% over the 12 week period). This is a relatively small study (48 cows) and it would be see what the impact is throughout the life of dairy cattle (as often gut flora adapts to these kinds of additives over time), but this combined with a couple of similar studies they cite are exciting enough to be worth recommending more trails and pilots.

Kinley et al 2016 is a similar paper looking at a different feed additive (this one based on seaweed). This is only an in vitro study (messing with petri dishes rather than actual cows) but they found adding doses of 2% or greater to a grass diet virtually eliminated methane production. Note that a very similar paper (Machado et al 2015) had similar results, but with two key differences: they saw a strong benefit at 1% dose (where Kinley had a weaker response at that dose), and they also saw some side effects that could impact cattle health at 2% and above. While this was only in vitro and only tested for 3 days, it's still worth investigating and comparing to 3NOP for efficacy and potential positive and negative side effects.

Swain et al 2018 (it came out online early) is a paper from the Breakthrough Institute arguing for a shift to more intensive livestock systems, especially switching from grass-finished to grain-finished beef. They make a number of good points; it's not really debatable that feedlot cattle require less land and time, and most scientists agree the GHG emissions are lower per unit of meat in feedlot systems as well. They briefly discuss some of the potential tradeoffs including animal welfare and antibiotic use and how they might be addressed, and the issue of how to ensure that higher productivity actually leads to land sparing as opposed to driving more habitat conversion. While a good read, there are a few things they don't cover that should also be part of the conversation. One is that in some cases we may actually prefer a high land use footprint, if the grazing lands are high-quality natural grasslands that would otherwise be converted to other uses. But it's still a worthwhile read with good food for thought.

Odadi et al. 2017 (authored by a NatureNet fellow, along with TNC's Joe Fargione) looks at the impact of planned grazing (focus on intensive rotational grazing, but including several other factors) on a variety of outcomes in Kenya. They found substantial improvements in vegetation (cover, species richness and diversity, etc.), presence and richness of wildlife, cattle weight gain during dry periods when they were in poor condition, and the amount of cattle supported per unit of land area. The cool thing to highlight here is that they were able to improve cattle condition as well as wildlife habitat. One critical ingredient to success was more active involvement from pastoralists; this does mean more effort for them but it appears that the benefits make it worth promoting.

AGRICULTURE:

Remember the synthesis of evidence for how several agricultural practices impact a suite of outcomes that Rodd Kelsey led (I sent it out last month)? This month I'm sharing one more 2-page document, which has a great chart summarizing the evidence for each of the practices evaluated on each of the outcomes. If you want to explore more deeply, you can do so at http://www.conservationevidence.com/data/index/?synopsis_id[]=22


REFERENCES:
Herrero, M., Conant, R., Havlik, P., Hristov, A. N., Smith, P., Gerber, P., … Thornton, P. K. (2016). Greenhouse gas mitigation potentials in the livestock sector. Nature Climate Change, 6(May), 452–461. https://doi.org/10.1038/nclimate2925

Hristov, A. N., Oh, J., Giallongo, F., Frederick, T. W., Harper, M. T., Weeks, H. L., … Duval, S. (2015). An inhibitor persistently decreased enteric methane emission from dairy cows with no negative effect on milk production. Proceedings of the National Academy of Sciences of the United States of America, 112(34), 10663–10668. https://doi.org/10.1073/pnas.1504124112

Kinley, R. D., De Nys, R., Vucko, M. J., MacHado, L., & Tomkins, N. W. (2016). The red macroalgae Asparagopsis taxiformis is a potent natural antimethanogenic that reduces methane production during in vitro fermentation with rumen fluid. Animal Production Science, 56(3), 282–289. https://doi.org/10.1071/AN15576

Machado, L., Magnusson, M., Paul, N. A., Kinley, R., de Nys, R., & Tomkins, N. (2016). Dose-response effects of Asparagopsis taxiformis and Oedogonium sp. on in vitro fermentation and methane production. Journal of Applied Phycology, 28(2), 1443–1452. https://doi.org/10.1007/s10811-015-0639-9

Odadi, W. O., Fargione, J., & Rubenstein, D. I. (2017). Vegetation, Wildlife, and Livestock Responses to Planned Grazing Management in an African Pastoral Landscape. Land Degradation and Development, (March). https://doi.org/10.1002/ldr.2725

Swain, M., Blomqvist, L., McNamara, J., & Ripple, W. J. (2018). Reducing the environmental impact of global diets. Science of the Total Environment, 610–611, 1207–1209. https://doi.org/10.1016/j.scitotenv.2017.08.125