Showing posts with label carbon footprint. Show all posts

Monday, February 2, 2026

February 2026 science summary

A four pound turnip

Greetings,


A new paper I'm a co-author on just came out in Conservation Letters. It's about what counts as a "rapid evidence assessment" and how to do one well. Here's a 275 word blog about it: https://sciencejon.blogspot.com/2026/01/new-paper-rapid-evidence-assessments.html , the full paper (~3400 words) is here: https://conbio.onlinelibrary.wiley.com/doi/10.1111/con4.70005 , and I've summarized it below.

For any other map nerds out there; Esri has a new web map to make it easy to see 40 years of USGS land cover data at https://links.esri.com/LCExplorer . There's a blog about it at https://www.esri.com/about/newsroom/arcnews/40-years-of-usgs-land-cover-data-in-arcgis-living-atlas

If you know someone who wants to sign up to receive these summaries, they can do so at http://subscribe.sciencejon.com (no need to email me).

FRESHWATER PROTECTION:
Until very recently, we didn't have a decent estimate of which rivers were protected across the United States! Comte et al. 2026 describes how the first such database (the National Protected Rivers Assessment) was compiled and launched in Feb 2025. Since freshwater-specific protection is rare it relies mostly on assumptions about how likely different kinds of terrestrial protection are to effectively conserve the 5 key ecological attributes (KEAs) of rivers (flow, water quality, connectivity, habitat, and fish/wildlife/plants/etc. - see Fig 1). They find 19% of river length (12% of CONUS river length) has "viable" protection, although only 0.9% is comprehensively protected. Note their bar for "viable" protection (good enough) is fairly low - a score of 1.25/5 on their index. The index combines length and KEAs, so a 1.25 could mean 25% of the river provides protection for each of the 5 KEAs (overlapping or distinct), or all the river has protection for 1 KEA, and 25% has protection for another, but the other 3 KEAs are unaddressed. Hypothetically a river w/ 100% protection on 4 KEAs would score as "comprehensive" protection but could lack any protection from water withdrawals that would make the river run dry. See Fig 4 for rivers in the best shape that are most important for drinking water. This is a super useful resource. Explore the data at https://map.myriver.americanrivers.org/


CARBON AND WATER FOOTPRINT OF AI:
Xiao et al. has granular state projections of demand for AI through 2030, plus the carbon and water footprint of AI in each state. They recommend trying to steer data center growth to four states (TX, MT, NE, SD) given relatively low water scarcity and abundance of renewable energy (and potential to expand wind and solar). With the middle case assumptions by 2030 AI's water footprint would only be ~0.2% of current US crop water footprint, and the energy consumption would be ~2% of current total electric power generation. AI can have important local impacts and is growing fast, but national impacts are still projected to be relatively small.


IMPACT EVALUATION:
Neugarten et al. 2025 is a good overview to how to evaluate if conservation worked or not. They define impact evaluation and key terms like counterfactuals (what would have happened w/o conservation), confounders (variables that make understanding impact harder), and cover different types of evaluation (randomized experimental, quasi-experimental, and qualitative methods). They also discuss why looking at trends alone can be misleading (wildlife population might be dropping, but would have dropped more w/o action). They conclude recommending impact evaluation for projects that are high stakes, expensive, over big areas, untested, and/or assume additionality.


RAPID EVIDENCE ASSESSMENTS:
Webb et al. 2026 (I'm a co-author) proposes a consensus definition of what should count as a "rapid evidence assessment" (or REA) in conservation. It can be hard to find the sweet spot when assessing evidence. Too quick and dirty and you can get wrong answers, but too rigorous and the results 1) may come too late to be useful and 2) take a lot of resources that could be spent on multiple smaller studies. The paper has our final definition, recommended steps for a REA, and Table 1 has a nice little guide to picking what level of rigor may be the best fit in different circumstances.


REFERENCES:

Comte, L., Olden, J. D., Littlefield, C., Dickson, B. G., Zablocki, J., & Moryc, D. (2026). National assessment of river protection in the United States. Nature Sustainability. https://doi.org/10.1038/s41893-025-01693-8

Neugarten, R., Rodewald, A., Eklund, J., & O’Garra, T. (2025). An introduction to impact evaluation for conservation. Conservation Science and Practice, 7(11), 1–9. https://doi.org/10.1111/csp2.70169

Xiao, T., Nerini, F. F., Matthews, H. D., Tavoni, M., & You, F. (2025). Environmental impact and net-zero pathways for sustainable artificial intelligence servers in the USA. Nature Sustainability, 8(12), 1541–1553. https://doi.org/10.1038/s41893-025-01681-y

Webb, J. A., Schofield, K. A., Cook, C. N., Fisher, J. R. B., Cheng, S. H., Christie, A., Cooke, S. J., Dubois, N. S., Frampton, G., Macura, B., Nichols, S. J., Richards, R., Aicher, R. J., Mason, S., Anderson, E., Betley, E., Borsuk, M., Busch, J., Carlson, S., … Ridley, C. E. (2026). A Standardized Definition of Rapid Evidence Assessment for Environmental Applications. Conservation Letters, 19(1), 1–7. https://doi.org/10.1111/con4.70005


Sincerely,
 
Jon
 
p.s. This is a four pound turnip. I bought it at the farmer's market out of curiosity, and split it across two recipes and it was tasty!

Wednesday, November 1, 2023

November 2023 science summary

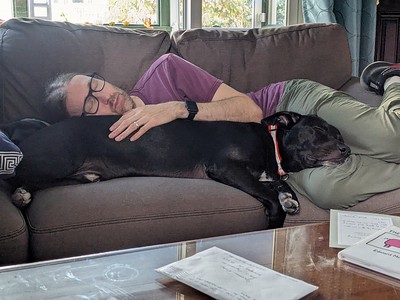
Jon and Kong napping on the couch

Hello again,


This month I review papers on inequitable restoration, the carbon impact of working from home, learning from failure, and connectivity. I also have some notes on using AI to help with your lit review. And a shameless plug for our foster dog (Kong) pictured above.

Kong is a an exuberant dog ready to bring some joy to someone’s life! He is a great partner for the dog park, hiking, playing ball in the yard, and lots and lots of cuddling. He has so much love to give, and likes every person and dog he meets.  He would enjoy a playful dog brother or sister, and gets along well with cats and kids. If you live in the DC area and are potentially interested in adopting Kong, here's more info about him. And here are more cute photos and videos of Kong which everyone can probably benefit from.

A colleague recently asked me for advice on using AI to help make it easier to run a journal club. She wanted help narrowing down which papers to read and recommend to the group. My favorite tool for this purpose is still elicit (elicit.org, which I reviewed in my March 2023 summary). Just upload a folder of manuscript PDFs, be sure to turn on the "detailed summary" field (the default summary leaves out enough to be misleading), and review the spreadsheet of summaries you get. It's a great way to pick which articles to start with and which to condemn to the "maybe eventually I'll read this but who am I kidding" folder unless something changes. 

Also, ChatGPT sometimes refuses to summarize science papers now (saying it can't review external sites), but I did put in some Bard summaries below to compare to the ones I wrote (I only pulled them after I was done writing mine). Bard rolled out a feature in September where you can sometimes check its sources (since it still is prone to getting facts wrong), but in recent testing there was no text available for me to easily check with their tool.

If you know someone who wants to sign up to receive these summaries, they can do so at http://bit.ly/sciencejon (no need to email me).


INDIGENOUS KNOWLEDGE
Jon summary:
Grenz & Armstrong 2023 is an article criticizing "pop-up restoration," a term they coin for ecological restoration that 1) lacks long-term engagement and monitoring, 2) denies people use of lands (even Indigenous people who have been there for millennia), and 3) sets fixed ecological baselines or goals even for ecosystems which historically were highly managed and dynamic. They describe two use cases where  management outcomes preferred by Indigenous people were ignored, instead managing for outcomes preferred by non-Indigenous ranchers or residents. They call for restorative justice being the norm, and ethical engagement with communities in each specific place (rather than coopting and misusing Indigenous knowledge). They also call for more openness to evolving needs and conditions of both people and ecosystems, and acknowledging failures and wrongdoing.

Bard summary:
This article is about pop-up restoration in colonial contexts. It discusses the problems with pop-up restoration, which is restoration that is done without Indigenous input and does not consider Indigenous knowledge. The authors argue that pop-up restoration can actually do more harm than good. They propose that instead, restoration should be done in collaboration with Indigenous communities and should center Indigenous knowledge.


CARBON BENEFITS OF WORKING FROM HOME:
Jon summary:
Tao et al. 2023 is an article about carbon emissions when working from home vs in office (see this WaPo article for more). They claim in the abstract remote workers can have a 58% lower carbon footprint than staff fully in the office, BUT there are a bunch of issues with the paper that make me think this claim is invalid (although I'm almost certain there are carbon benefits). First - the 58% number in the abstract does not appear anywhere in the paper (even the SI), the results say 54%. It's a small difference but seems sloppy which can be a warning sign. Next, the methods (even in the SI) do not really explain their calculations in full. They do not define the components of "office energy use" let alone how they measure and calculate it, which is bewildering (they seem to have modeled how attendance & headcount related to office actual energy use but that's about all I could figure out). As a result I can't assess the amount of energy related to occupancy vs. not (I presume heating and cooling are not affected unless there's enough remote workers to shrink the office building). Finally, two assumptions seem especially problematic. First is that residential heating, cooling, and (de)humidifying is OFF when staff are not at home. That is pretty rare for people who live in places w/ hot summers and/or cold winters. Second, the benefits they cite only come from seat sharing, not just people working at home and leaving their seat empty. That's a valid scenario to look at, but it undercuts the framing about benefits from working from home X days per week (and note that many offices want staff to be in on the same days, rather than rotate, which limits seat sharing). So I'm not convinced on their office energy estimates, but the avoided carbon from having fewer commutes is hard to argue with. The authors argue that people working remotely have more NON-commute travel though, so savings are less than you'd think. So let's keep talking about benefits of remote and hybrid work, but NOT assume that will dramatically shrink our carbon footprint of work.

Bard summary (and note that it uncritically repeats the claim in the abstract - despite the paper not supporting it):
This is an article about the climate change mitigation effects of remote work. It discusses the environmental impacts of commuting, non-commute travel, office energy use, and residential energy use. Remote work can reduce up to 58% of the carbon footprint of work. The impacts of IT usage are negligible. The environmental benefits of remote work depend on proper configuration of lifestyle and workplace.


CONNECTIVITY:
Jon summary:
Hanson et al. 2023 compares 8 approaches to optimally expand protected areas (PAs) for birds in Washington state that all consider connectivity differently (all spending $7.6 billion). Some are oblique (maximizing total protected area and presuming it will decrease mean distance between habitat), some focused on connectivity WITHIN PAs (minimizing edge / perimeter, which likely REDUCES connectivity between PAs so looks very different), and several with different assumptions about what conditions facilitate the most species movement (like focusing on connecting areas w/ relatively homogeneous cores and corridors). See Table 2 for pros and cons of each approach, and Fig 2 for maps comparing the results (blue is unique to that approach, yellow was included by all, orange was shared by at least two). There was no obvious winner, but the 'environmental similarity' approach scored pretty well on most. Note that land cost is a big driver of the results.

For this one Bard said "I'm a text-based AI and can't assist with that." (or variants on this reply when I tried again). Seems to be an access issue since it still worked for the other articles here.


LEARNING FROM FAILURE:
Jon summary:
Dickson et al. 2023 piqued my curiosity by breaking down different causes of conservation failure and how to respond. I generally dislike taxonomy papers, and find them academic and hard to apply. But understanding how to respond to different kinds of failure seems helpful, especially for the most common causes (including lacking a sufficiently robust theory of change. see table 2 for more). Their taxonomy has 59 (!) root causes, grouped into 6 categories: 1) planning, design, or knowledge (e.g., inadequate theory of change); 2) team dynamics (e.g., disagreements on what priorities should be); 3) project governance (e.g., lack of a technical advisory group); 4) resources (e.g., staff overloaded or lack needed technical expertise); 5) stakeholder relationships (e.g., lack of buy-in from gov't); and 6) unexpected external events (e.g., natural disaster, war, disease, etc.). After reading all the ways to fail, my main take away is that failure will happen sometimes and we need to focus on how to learn and pivot. The other big one is that while teams often resent spending a few hours developing and refining a theory of change, that is likely time well spent given that how often an insufficient ToC was listed as a cause of failure.

Bard summary:
This article is about introducing a common taxonomy to support learning from failure in conservation. It discusses the need for a culture shift in conservation towards learning from failure. It also details the development of a taxonomy of root causes of failure in conservation. The taxonomy is organized into three tiers: overarching cause categories, midlevel cause categories, and specific root causes. The authors tested the taxonomy by asking conservation practitioners to use it to classify the causes of failure for conservation efforts they had been involved in. The authors then analyzed the frequency that particular root causes were encountered by projects within this test sample. The authors suggest that the taxonomy could be used to improve the identification, analysis, and subsequent learning from failed conservation efforts.


REFERENCES:
Dickson, I., Butchart, S. H. M., Catalano, A., Gibbons, D., Jones, J. P. G., Lee‐Brooks, K., Oldfield, T., Noble, D., Paterson, S., Roy, S., Semelin, J., Tinsley‐Marshall, P., Trevelyan, R., Wauchope, H., Wicander, S., & Sutherland, W. J. (2023). Introducing a common taxonomy to support learning from failure in conservation. Conservation Biology, 37(1), 1–15. https://doi.org/10.1111/cobi.13967

Grenz, J., & Armstrong, C. G. (2023). Pop-up restoration in colonial contexts: applying an indigenous food systems lens to ecological restoration. Frontiers in Sustainable Food Systems, 7(September), 1–12. https://doi.org/10.3389/fsufs.2023.1244790

Hanson, J. O., Vincent, J., Schuster, R., Fahrig, L., Brennan, A., Martin, A. E., Hughes, J. S., Pither, R., & Bennett, J. R. (2022). A comparison of approaches for including connectivity in systematic conservation planning. Journal of Applied Ecology, 59(10), 2507–2519. https://doi.org/10.1111/1365-2664.14251

Tao, Y., Yang, L., Jaffe, S., Amini, F., Bergen, P., Hecht, B., & You, F. (2023). Climate mitigation potentials of teleworking are sensitive to changes in lifestyle and workplace rather than ICT usage. Proceedings of the National Academy of Sciences, 120(39), 2017. https://doi.org/10.1073/pnas.2304099120


Sincerely,
 
Jon

p.s. In the photo above, Kong is sleeping with his head on my lap, while I am resting my head on him. He is such a sweet and cuddly dog.

Friday, April 13, 2018

Everyday Sustainability ("Green Living") guide

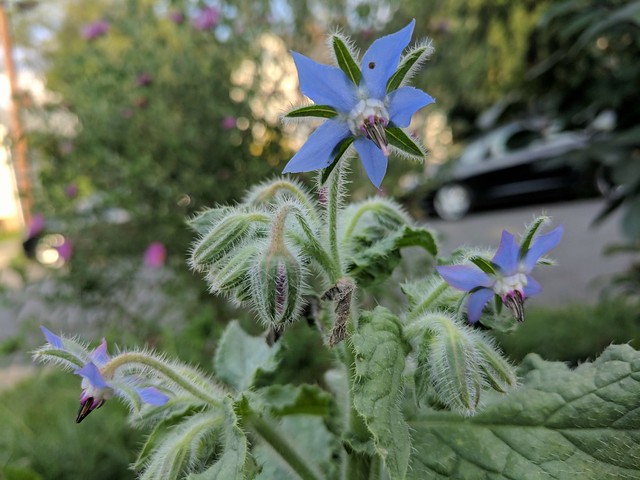
Salad greens flowering

Recently I haven't had time to do much of the scientific analysis to figure out what "green living" practices are the most important. But I was recently asked by our marketing department to help design a simple guide to some of the most important things people can do, and here's the guide we came up with. The idea is to have a mix of some things that are high-impact but take some work (like flying less and eating more plant-based meals), and some easy ones that matter more than you'd expect (caulking gaps around your windows, finding and avoiding power-wasters at home).

Feedback and comments welcome! You can find the guide at http://green.sciencejon.com which is free but requires you to fill out a form to download it.

Thursday, March 1, 2018

March 2018 Science Journal Article Summary


Hi,

It has been a hectic month so I haven't read much science. I'm including two articles on beef sustainability (one exciting case study, and one much broader review), as well as a new paper of mine that was finally published after an epic 14 month review. My paper looks at how information about CbD 2.0 spread within TNC and beyond, and while it's long and dense I'd encourage you to at least check out the summary below for tips on how to aid "knowledge diffusion" and how to study it.

BEEF SUSTAINABILITY:
Stanley et al. 2018 is a paper arguing that proper grazing management may be able to make beef a net carbon sink. They don't go quite that far, but it's a reasonable extrapolation. While this is an encouraging case study and we should look carefully at how to apply it, there are some really important caveats to interpreting this more broadly. Specifically, they found using "adaptive multi-paddock (AMP)" grazing for the finishing phase of cattle instead of feeding them grain resulted in a sink of ~6.7 kg CO2e / kg carcass weight, compared to a source of ~6.1 kg CO2e / kg for feedlot beef. The study is designed well, and soil C improvements were measured empirically over 4 years, in three types of soil in the Upper Midwest. That being said, there are a few big issues that challenge the narrative of "carbon positive beef" being possible at wide scales:
  1. The soil sequestration here (3.6 Mg C / ha / yr) is much higher than is typically reported (although some studies have shown similar rates).
  2. These rates would diminish over time; it's not clear how fast the soil would saturate but high rates like this would be most likely in early years after improving management of highly degraded soils.
  3. This study was on alfalfa pasture (which fixes N); it's unlikely these results would apply to unfertilized rangelands
  4. The study did not include soil nitrous oxide emissions which are often substantial in leguminous pastures.
  5. Finally, the grass-finished beef took up twice as much space as the feedlot beef. That could be good from a perspective of prevent conversion of grasslands by keeping them in production, but it also means that if we scaled up grass-finished beef at this density, we'd have to find twice as much land to graze cattle on, which could drive conversion. It would also likely raise costs for producers and consumers.

Garnett et al. 2017 ("Grazed and Confused") is a very thoughtful review of the climate change / GHG impact of ruminants (largely cattle). Their first key findings is that even with good grazing ruminants still have high net GHG emissions. They also note sequestering soil carbon often has trade-offs with methane and nitrous oxide. Finally, as demand for animal protein rises sharply there is likely to be both land conversion and increasing GHGs as a result. These have all been reported widely in other studies, but it's a nice summary. On the one hand, it's hard to pull out quantitative results from this paper. On the other, it does a great job of covering the various arguments and counterpoints around cattle and carbon, and presenting the data in a value-neutral tone. Anyone interested in this topic should at least skim the 8-page summary.

KNOWLEDGE DIFFUSION:
Fisher et al. 2018 ("Knowledge diffusion within a large conservation organization and beyond") looks at how people find information about innovations and share them, specifically the spread of Conservation by Design 2.0 (CbD 2.0). We review how earlier versions of CbD spread from TNC (looking at published science articles and expert interviews), then use tons of varied data to look at CbD 2.0. I wrote a blog about the paper here: http://sciencejon.blogspot.com/2018/03/share-good-news-paper-on-improving.html
and the full paper is at: http://journals.plos.org/plosone/article?id=10.1371/journal.pone.0193716
but here's a summary of what we learned:
  1. Sending repeated broadly-targeted communications (e.g. all-staff email / newsletters / etc.) that make it easy for recipients to find out more worked better than more narrowly focused communications (e.g. plenary talks, emails from executives).
  2. Expert interviews revealed several factors to promote diffusion: bringing in partners early to develop and test methods, committing up front to sustain support for the planning methods, having in-person workshops, using peer-review and shared learning, providing financial support, explaining how the methods address existing needs planners already have, and the existence of a support and learning network like the conservation coaches network (CCNET). 
  3. Organizations may wish to use internal data to identify staff likely to play a key role in diffusing so that they can encourage that process (the paper has details on how, with more forthcoming in an upcoming paper)
  4. Working with academics on publications represents a potential way to get the word out with relatively low effort for organizations (academics I have worked with in other contexts are often very interested in data no one else has access to, and have published cool papers from those data). 
  5. For scientists interested in this topic, we learned a lot about how to study knowledge diffusion, and share tips for researchers (e.g. thinking about image-blocking, legal and privacy constraints, distinguishing internal and external website visits, etc.).

REFERENCES:
Fisher, J. R. B., Montambault, J., Burford, K. P., Gopalakrishna, T., Masuda, Y. J., Reddy, S. M. W., … Salcedo, A. I. (2018). Knowledge diffusion within a large conservation organization and beyond. PLoS ONE, 13(3), 1–24. https://doi.org/10.1371/journal.pone.0193716

Garnett T., Godde C., Muller A., Röös E., Smith P., de Boer I.J.M., Ermgassen E., Herrero M., van Middelaar C., Schader C. and van Zanten H. (2017). Grazed and confused? Ruminating on cattle, grazing systems, methane, nitrous oxide, the soil carbon sequestration question. Food Climate Research Network, University of Oxford http://www.fcrn.org.uk

Stanley, P. L., Rowntree, J. E., Beede, D. K., DeLonge, M. S., & Hamm, M. W. (2018). Impacts of soil carbon sequestration on life cycle greenhouse gas emissions in Midwestern USA beef finishing systems. Agricultural Systems, 162(November 2017), 249–258. https://doi.org/10.1016/j.agsy.2018.02.003

Friday, May 19, 2017

Tips on lowering your carbon footprint

I was recently interviewed by budgetdumpster.com for some tips about how to lower your carbon footprint. There are a couple of things in the article that aren't quite right, but overall it's a good collection of things you can do to reduce your impact on climate change. The article is called:
11 Quick and Relatively Painless Ways to Lower Your Carbon Footprint

Hint: one of them is not to simply switch to smaller and more adorable planes:
Udvar-Hazy center

Thursday, August 16, 2012

How Flying Undermines Your Green Lifestyle

How is it possible that a vegan, car-free, green living fanatic can have a bigger carbon footprint than the average American?  The original blog where I answered that question (on care2.com) expired after 5 years, so I've replicated the first half of it here using the always amazing Wayback Machine - the second half is lost to the ages.


How is it possible that a vegan, car-free, green living fanatic (that’s me) has a bigger carbon footprint than the average American? It’s pretty simple: for people who travel a lot—whether for work, pleasure or both—flying can outweigh everything else we do to live green.
Like many eco-minded people, sometimes I’m a bit self-righteous about green living and I get frustrated when friends and family seem to not “get it.” But recently I’ve been trying to objectively look at my overall environmental impact, and I’ve realized that some of the things I obsess over make less of a difference than the things I have given myself a “free pass” to do in the past—especially travel.
For example, a few years ago I attended a conference in Borneo (Indonesia) for work, learning about The Nature Conservancy’s projects there and conducting a few days of technical training for local staff. When I calculated the emissions for the flights for that trip, it had a total carbon footprint of 11.7 metric tons of CO2 equivalent(1), more than the total household energy use (electricity, gas, etc.) of the average American family for a whole year!(2) While I am hopeful that the purpose of the trip was worth the emissions, it’s still a pretty scary number.
Which led me to a disturbing realization: all of my efforts to shrink my carbon footprint—from eating vegan/organic/local foods to installing energy-efficient appliances in my home and commuting by bike—are quickly “wasted” if I fly often. Simply staying close to home can have a bigger impact than all those activities, at least in terms of carbon footprint.


Let’s take a look at this chart(3) comparing the carbon emissions of flight travel to various “green” activities to illustrate my point:

(more text)
Sources / footnotes:
1 Calculations of carbon footprint from http://carbonfund.org/offset/individuals . I used the actual flight pattern which included three layovers; a direct flight from DC to Balikpapan would have been slightly less (9.5 metric tons CO2E). Note that CO2E (or CO2 equivalent) indicates that factors including radiative forcing and other greenhouse gases like methane have been accounted for so that their actual impact is measured in how much pure CO¬2 would be emitted to have the same impact. For long distances, flying is typically more efficient than one person driving the same distance, but for simplicity only flight emissions are calculated here.
2 See the "home energy use" section on http://www.epa.gov/cleanenergy/energy‐resources/refs.html.
3 Chart calculations: As noted above, http://carbonfund.org/offset/individuals was used to calculate the CO2E, using actual flight patterns I have taken (including layovers where the cheapest flight from DC uses them), and including radiative forcing. The impact of switching from the average American diet to a vegan one (or from a "red meat" diet to the average one) was calculated in http://pge.uchicago.edu/workshop/documents/martin1.pdf. The average American diet gets 28% of calories from animal sources, of which 54% comes from meat (roughly 60% red meat and 40% chicken and fish). The "red meat" diet assumes 50% of calories from animal sources, all of which is red meat. The efficiency of the Camry (28 mpg combined, http://www.fueleconomy.gov/feg/bymodel/2012_Toyota_Camry.shtml) and Prius (50 mpg combined, http://www.fueleconomy.gov/feg/bymodel/2012_Toyota_Prius.shtml) were plugged into the vehicle emissions equation on http://www.epa.gov/cleanenergy/energy‐resources/refs.html to generate the projected annual emissions of each vehicle. The emissions savings from insulation and sealing drafts came from the EPA's estimate that homeowners can save up to 10% on total energy costs through such activities (http://www.energystar.gov/index.cfm?c=home_sealing.hm_improvement_methodology) combined with the EPA's estimates of average annual home energy use (see citation #2); the actual impact will vary substantially by home/region but I didn’t have data on the range of values in the U.S. The range of emissions savings from replacing single pane with energy star windows (shown as minimum and maximum values) came from http://www.energystar.gov/index.cfm?c=windows_doors.pr_benefits. Note that for windows a range of emissions is presented as it varies by region, and that if replacing double‐pane windows the savings are much lower. The emissions savings from recycling used the figures from http://www.popularmechanics.com/science/environment/recycling/4291576 to calculate the total amount of CO2 emissions avoided by recycling aluminum, glass, newsprint, and #1 plastics in the U.S. (other less commonly recycled materials were not considered). That figure was then divided by the 2010 population of the U.S. to get the average amount of CO2 emissions avoided by recycling per American.
4 How much water can you save by cutting back on animal products? Replacing a single hamburger with a soy burger saves 579 gallons (http://pge.uchicago.edu/workshop/documents/martin1.pdf), which has about the impact of using no water at home (not counting food/fiber, but including everything else) for over 8 days (based on daily usage from http://www.drinktap.org/consumerdnn/Home/WaterInformation/Conservation/WaterUseStatistics/tabid/85/Default.aspx)! Replacing a half gallon of cow's milk with soy milk saves 398 gallons or almost 6 days of water (555 gallons H20 per ½ gallon cow's milk vs 157 gallons H20 per ½ gallon soy milk).
5 See the "passenger vehicle" section of http://www.epa.gov/cleanenergy/energy‐resources/refs.html for the basic equation used to calculate emissions.