
|
Eyyyy!
If you know someone who wants to sign up to
receive these summaries, they can do so at http://subscribe.sciencejon.com (no
need to email me).
|
|
Eyyyy!
If you know someone who wants to sign up to
receive these summaries, they can do so at http://subscribe.sciencejon.com (no
need to email me).
|
Greetings,
This month I only have three science articles but they're all good'uns.
If you know someone who wants to sign up to receive these summaries, they can do so at http://bit.ly/sciencejon (no need to email me).
PROTECTED AREAS:
Sullivan-Stack et al. 2022 is a great summary of marine protected areas (MPAs) in the U.S., and flags that achieving 30% U.S. ocean protection by 2030 is not on track to provide sufficient benefit to marine ecosystems. The key finding that stood out to me was the need for improving both geographic representation and efficacy / strength of protection (as well as climate resilience and equity). U.S. oceans are 26% protected overall (25% fully or highly protected), but 96% of that is in the central Pacific ocean. Excluding that region, only 2% has any protection (and only 22% of that 2% is fully or highly protected). See Table 3 for a summary of how much of each region is protected and at what level (Figure 1 has a map but it's not split by protection strength). Alaska has the lowest % protection of any kind (0.7%) while OR & WA have the weakest protection (4.2% of ocean is protected, but that's all minimal protection). Skip to section 4 for their recommendations: create more effective MPAs (via new ones and strengthening existing ones), improve representation of different marine regions & species & habitats in well-connected MPAs, improve equity & access, go beyond tracking % coverage and include impact assessments, make MPAs durable and climate resilient, coordinate state MPAs, reinstate and empower the MPA Federal Advisory Committee, strengthen & fund the NOAA MPA Center, and update the U.S. National Ocean Policy for holistic ocean planning and management.
ECOSYSTEM INDICATORS:
Nicholson et al. 2021 is chock full of useful diagrams and lists. They have a number of recommendations for setting ecosystem goals (which have milestones, targets, and indicators) for a global biodiversity framework, but which can be relevant to other efforts (like 30x30). At a high level they flag the need to track not only total ecosystem/habitat area (or extent), but also changes in ecosystem integrity (including the risk of ecosystem collapse - see Box 2 for definitions). Fig 2 is a nice visual summary of how different types of targets can collectively capture different threats and ecosystem attributes that need to be addressed for long term ecosystem health. Fig 3 is a super helpful review of many different environmental indices / metrics, and what aspects of ecosystems they include and omit. Spend some time with that one - even learning about all of the indices was very helpful for me. They close with 6 recommendations for picking indicators: we need a set of them (no single one suffices), they need to reflect goals (not actions), relevance to the goal is at least as important as data availability, we need more testing and validation of indicators, we need stronger connections between global indicators and national or local policies, and we need new indicators to provide early warning of ecosystem collapse.
ECOSYSTEM CONDITION:
There are good remote sensing data for land cover change, worse but decent data for land use change, but generally not much on degradation (which means we can underestimate ecological decline). Swaty et al. 2021 describe a "Vegetation Departure" (VDEP) spatial data set for the US which gets at this. This includes whether early or late successional stages are over-represented or under-represented (think of a logged forest w/ no old growth left but plenty of young forest, or a grassland being taken over by denser shrubs which were historically less common). They highlight several limitations of the existing LANDFIRE VDEP data (which focuses on canopy cover and height), and recommend that users consider other attributes that are important to their ecosystems of interest (e.g., biodiversity, wildlife populations, wildfire risk, etc.).
REFERENCES:
Nicholson, E., Watermeyer, K. E., Rowland, J. A., Sato, C. F., Stevenson, S. L., Andrade, A., Brooks, T. M., Burgess, N. D., Cheng, S.-T., Grantham, H. S., Hill, S. L., Keith, D. A., Maron, M., Metzke, D., Murray, N. J., Nelson, C. R., Obura, D., Plumptre, A., Skowno, A. L., & Watson, J. E. M. (2021). Scientific foundations for an ecosystem goal, milestones and indicators for the post-2020 global biodiversity framework. Nature Ecology & Evolution, 5(10), 1338–1349. https://doi.org/10.1038/s41559-021-01538-5
Sullivan-Stack, J., Aburto-Oropeza, O., Brooks, C. M., Cabral, R. B., Caselle, J. E., Chan, F., Duffy, J. E., Dunn, D. C., Friedlander, A. M., Fulton-Bennett, H. K., Gaines, S. D., Gerber, L. R., Hines, E., Leslie, H. M., Lester, S. E., MacCarthy, J. M. C., Maxwell, S. M., Mayorga, J., McCauley, D. J., … Grorud-Colvert, K. (2022). A Scientific Synthesis of Marine Protected Areas in the United States: Status and Recommendations. Frontiers in Marine Science, 9(May), 1–23. https://doi.org/10.3389/fmars.2022.849927
Swaty, R., Blankenship, K., Hall, K. R., Smith, J., Dettenmaier, M., & Hagen, S. (2021). Assessing Ecosystem Condition: Use and Customization of the Vegetation Departure Metric. Land, 11(1), 28. https://doi.org/10.3390/land11010028
Sincerely,
Jon
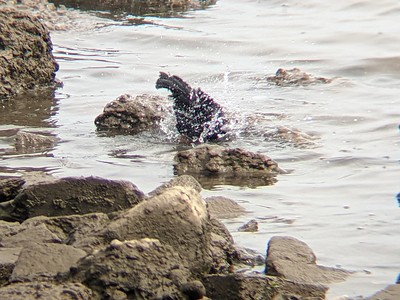
p.s. The photo above is of a red-winged blackbird bathing in the Potomac River at Dyke Marsh

Greetings,
Before diving into journal articles, I want to highlight a blog, short video, and web map update. First, over the last several years of working in conservation, I hear more and more calls for conservation to rapidly scale effective solutions. Sometimes that's coupled with a sense of urgency that makes us think we don't have time for missteps or to do things that don't work. But this article makes a compelling case that if we want to scale fast, that means we will need a higher tolerance for the risk of failure. It's a good read! https://ssir.org/articles/entry/getting_honest_about_what_were_willing_to_risk_for_the_planet#
Want to know how (and why) to talk to "uncle Ernie" and other people who are not convinced we need to urgently act on climate change? Check out Dr. Katherine Hayhoe's interview on Jimmy Kimmel: https://youtu.be/LVjmGVufADk
The last quick update is for those of you working in South America. The latest update to Mapbiomas includes fire scars and water surface area: https://plataforma.brasil.mapbiomas.org/agua
They have cool graphs showing changes (drops) in water area over time. The (user's) accuracy is mostly 75% or above, but it's really low in the Pantanal (see https://mapbiomas.org/metodo-agua). They saw a huge drop there (74% less water over 30 years) but it's hard to know how much of that is real. Unfortunately the high variation throughout the year makes validating annual estimates of water surface inherently tricky.
If you know someone who wants to sign up to receive these summaries, they can do so at http://bit.ly/sciencejon
CLIMATE CHANGE:
Welsby et al. 2021 ask an interesting question: what fraction of economically viable fossil fuels need to left in the ground to give us a 50% shot at limiting warming to 1.5C? The answer is pretty stark: by 2050 we need to leave 58% of oil, 59% of methane gas, and 89% of coal underground (a 3% annual reduction in oil and gas). See table 1 for their estimates by region. They note that we may need to leave even more fuels unextracted given questions about how fast we can develop "negative emissions" technology (carbon capture and storage).
Zhang et al. 2020 finds that 3.7% of total natural gas (mostly methane) extracted in the Permian basin (west Texas and SE New Mexico) is lost via leaks (w/ 4.1% lost in the Delaware sub-basin). It's a cool study using a recent satellite to estimate methane emissions, and EDF is launching a more precise satellite for this in 2022. This is a big deal because given methane has ~84 times the impact of CO2 on global warming over the next 20 years (dropping after that). So this leakage rate means that right now natural gas from the Permian has more short-term climate impact than coal (see http://blogs.edf.org/energyexchange/2013/11/05/methane-a-key-to-dealing-with-carbon-pollution/)! The authors think the leaks in this region are mostly from venting and flaring during active production (as opposed to leaks after well abandonment)
MARINE PROTECTED AREAS:
Sala et al. 2021 identify global priorities to designate as marine protected areas (MPAs), with the goal of protecting biodiversity and carbon while improving the yield of fisheries. The yield improvements come from targeting areas that are currently both overexploited and unprotected; they find protecting 9% of the ocean could boost maximum sustainable yield (MSY) from seafood by about 10% (protecting 5% increases yield by ~9%, Fig 1d,). The authors recommend protecting 28% of the ocean (not 9%) but their data seem to indicate the food benefit is the same at both levels. Fig 3 has some other interesting scenarios, including giving equal weight to food and biodiversity (3c, leading to a recommendation to protect 45% of the ocean which provides 92% of maximum fisheries benefit, 71% of max. biodiversity benefit, and 29% of max carbon benefits) or maximizing biodiversity without harming production (3d, recommending to protect 71% of the ocean which provides neither fisheries benefit nor harm, 91% of max. biodiversity benefit, and 48% of max carbon benefits). The unequal distribution of priority areas (Fig 1 & 2) raise potential equity concerns that are not addressed. Also apparently the carbon estimates do not account for additional boat travel time and thus may be optimistic. Finally: I know very little about marine ecosystems so let me know if you think my summary is wrong.
UPDATE: Concerns have been raised about the model this paper is based on, and the earlier paper this builds on has been retracted primarily due to an undisclosed conflict of interest: https://sustainablefisheries-uw.org/flawed-mpa-science-retracted/
REFERENCES:
Sala, E., Mayorga, J., Bradley, D., Cabral, R. B., Atwood, T. B., Auber, A., Cheung, W., Costello, C., Ferretti, F., Friedlander, A. M., Gaines, S. D., Garilao, C., Goodell, W., Halpern, B. S., Hinson, A., Kaschner, K., Kesner-Reyes, K., Leprieur, F., McGowan, J., … Lubchenco, J. (2021). Protecting the global ocean for biodiversity, food and climate. Nature, 592(7856), E25–E25. https://doi.org/10.1038/s41586-021-03496-1
Welsby, D., Price, J., Pye, S., & Ekins, P. (2021). Unextractable fossil fuels in a 1.5 °C world. Nature, 597(7875), 230–234. https://doi.org/10.1038/s41586-021-03821-8
Sincerely,
Jon
p.s. the photo above is of me driving an excavator at Diggerland, which was quite fun albeit not the greenest activity
