Thursday, December 1, 2022

December 2022 science summary

Victoria sunrise

Happy December,


In the spirit of the paper on gratitude below: thank you all for helping me to be a better scientist and a better person. Almost every month I get a note or two from someone who found the summary useful, or who had a question / critique / idea that I learned from. That engagement has helped me push myself to keep doing these, which in terms helps me be a bit more well-read. So thank you!

Also, while they're too long to summarize briefly like I do with papers, I want to recommend the books "Think Again" by Adam Grant and "Noise" by Daniel Kahneman, Olivier Sibony, and Cass R. Sunstein. Taken together, they've given me a lot of ideas about how to get better at reevaluating my beliefs, improving how I review evidence and draw conclusions, and generate estimates. Email me if you want some notes I took on my favorite parts of each!


GRATITUDE:
As a follow-up to the Thanksgiving holiday, I wanted to share a review of a paper on gratitude by Wood et al. 2010. It's a broad review of research on the topic and fairly wonky, but I found a few things useful. I liked how table 1 lists complementary aspects of gratitude: noticing how grateful you are overall, feeling gratitude towards others, focusing on what you have (vs. what you lack), feelings of awe, expressing gratitude (internally and to others), being present, living to the fullest b/c of awareness that life is short, and feeling lucky when thinking about how things could be worse. They cover quite a lot of research on gratitude and how being more grateful is associated w/ better quality of life (although there's some question how much gratitude causes well-being vs. is just correlated). The biggest boost to feeling good came from writing a letter thanking someone and reading it to them in person, but keeping a daily diary of three things you're grateful for seems to be easier to keep up and helps you feel better for longer.


CLIMATE CHANGE
Reich et al. 2022 is an interesting experiment of how boreal forests might respond to 1.6C or 3.1C warming, using open-air heaters in an actual forest (as well as simulating reduced rainfall by covering some of the soil) to see how they respond. Conifers experienced slower growth (Fig 2) and higher mortality (Fig 1). How much varied by species, with balsam fir showing the worst impact. Compared to current conditions, warming or limited rain each reduced balsam fir growth by ~1/3, while the combination reduced growth by ~2/3. Seedling survival went down by ~40% at 1.6C, ~72% at 3.1C, and ~84% at 3.1C plus less rain. But others like jack pine had much smaller effects, and some trees like maples had similar survival rates and more growth under warming (even with less rain). So they predict that conifers will become less dominant, over the long term being replaced by deciduous trees but in the short term more likely replaced by invasive woody shrubs (since the deciduous trees aren't common enough to spread fast). There is an article about this written for general audiences at https://phys.org/news/2022-08-modest-climate-northernmost-forests.html


SUSTAINABLE RANCHING:
Santos et al. 2017 is an interesting paper on using fuzzy logic to assess beef sustainability in the Pantanal. As background - fuzzy logic doesn't mean 'sloppy reasoning' - it's actually a real thing which more or less centers on non-binary logic models. For example, old thermostats are non-fuzzy (they turn on when cold and turn off when warm enough), but newer ones are often fuzzy (adjusting fan speed, turning auxiliary heat on or off, etc. depending on performance). In this case, they take a ton of practical indicators, map each onto a 4 point scale, and combine them into a single "overall sustainability index" (see Figure 1). Check out Appendix I for the list of how well each indicator matched expert judgments.


OTTERS:
Valladares et al. 2022 used drones to figure out what kind of habitat giant otters in Peru most preferred. They found giant otters preferred oxbow lakes with the largest water surface area, the least floating vegetation (more open water), and more dense forest canopy cover along the banks of the lakes.


REFERENCES:
Reich, P. B., Bermudez, R., Montgomery, R. A., Rich, R. L., Rice, K. E., Hobbie, S. E., & Stefanski, A. (2022). Even modest climate change may lead to major transitions in boreal forests. Nature, 608(7923), 540–545. https://doi.org/10.1038/s41586-022-05076-3

Santos, S. A., de Lima, H. P., Massruhá, S. M. F. S., de Abreu, U. G. P., Tomás, W. M., Salis, S. M., Cardoso, E. L., de Oliveira, M. D., Soares, M. T. S., dos Santos, A., de Oliveira, L. O. F., Calheiros, D. F., Crispim, S. M. A., Soriano, B. M. A., Amâncio, C. O. G., Nunes, A. P., & Pellegrin, L. A. (2017). A fuzzy logic-based tool to assess beef cattle ranching sustainability in complex environmental systems. Journal of Environmental Management, 198, 95–106. https://doi.org/10.1016/j.jenvman.2017.04.076

Valladares, N. A., Pardo, A. A., Chiaverini, L., Groenendijk, J., Harrington, L. A., Macdonald, D. W., Swaisgood, R. R., & Barocas, A. (2022). High‐resolution drone imagery reveals drivers of fine‐scale giant otter habitat selection in the land‐water interface. Conservation Science and Practice, December 2021, 1–14. https://doi.org/10.1111/csp2.12786

Wood, A. M., Froh, J. J., & Geraghty, A. W. A. (2010). Gratitude and well-being: A review and theoretical integration. Clinical Psychology Review, 30(7), 890–905. https://doi.org/10.1016/j.cpr.2010.03.005


Sincerely,
 
Jon

Tuesday, November 1, 2022

November 2022 science summary

Jack o' lantern w bloodshot eyes
Greetings,

Happy belated Halloween!

This month I have four articles on different facets of climate change (drought, ecological adaptation, and mitigation through peatlands), plus one big new global paper on the environmental impact of food.

If you know someone who wants to sign up to receive these summaries, they can do so at http://bit.ly/sciencejon


FOOD / AGRICULTURE:
Halpern et al. 2022 is the latest paper to try and compare the global environmental footprint of almost all foods (both aquatic and terrestrial), using greenhouse gases (GHGs but excluding land use change), "blue" water consumption (from irrigation), nutrient pollution (N&P, excluding crop N fixing), and land use. Note that blue water consumption excludes rainfall, and focuses on evaporation & transpiration as opposed to "water use" (the amount pumped out) much of which returns to surface and ground water. This lets us compare the impact of different foods, look at which foods have the most total impact (and thus offer the most opportunity to improve via changes in practice or biology), and see which countries have the most environmental impact from food (India, China, the U.S., Brazil, and Pakistan - see Figs 2, 3, and especially 4). Spend some time with Fig 4, it's dense and interesting. For example, you can see that India has slightly more total impact than China, but produces substantially less food by all 3 metrics (calories, protein, and mass). Most of the data here are similar to what we've seen before, but still interesting (e.g., U.S. soy is 2.4 times more efficient than Indian soy). Reporting "cumulative" impacts can be confusing - wheat and rice have similar total impact in Fig 5, but Fig 6 shows that rice is far more inefficient per tons of protein produced). Fig 5 and 6 would be useful in looking at which crops and livestock species to focus on improved genetics or practices to have the most impact. But if you want to know "what should I eat" this paper makes it really hard to find that (Fig 6 is closest, or look at Supplementary Data 3 for country-specific "total environmental pressure" data using the food key from Table S6). So for example they find goats have a higher impact than cows, and in the US soy is the most environmentally efficient source of protein while sugar beets are the most environmentally efficient source of calories.


CLIMATE CHANGE & DROUGHT:
Cook et al. 2015 estimates the likelihood of summer droughts (June through August) in the American Central Plains and Southwest between 2050 and 2100. Their findings are striking, even under the RCP 4.5 climate scenario (which they put in the supplement, focusing instead on the much less likely RCP 8.5 scenario). They predict the following chances of a decadal (11 year) or multidecadal (35 year) drought: decadal ~94% Central Plains and ~97% Southwest, multidecadal ~73%  Central Plains and ~80% for Southwest (see Fig S13 on the past page of the supplement). That's pretty scary, and they further note this is drier than even the historically dry period from the years 1100-1300. However, this is a lot more pessimistic than the IPCC (as the authors acknowledge), and I'm not qualified to go deep enough in the methods to weigh in as to how likely this is. But as we have already seen out West, droughts lasting multiple years have very different implications both for communities and agriculture. Tree crops will be increasingly untenable as the risk of multi-year droughts increase, and farmers may have to switch to very different crops to make it through these dry periods.


CLIMATE ADAPTATION (ECOLOGICAL):
Moore and Schindler 2022 is an opinion piece arguing that more diverse strategies are needed to help prepare ecosystems for climate change. They argue that conservation needs to adapt to shifting ecosystems and unpredictable futures by maintaining complexity, especially by promoting enhanced gene flow and facilitating the ability of habitat to shift to new places as climate changes. Given uncertainty in climate changes and ecosystem response, they argue that refugia may not be as robust as promoting climate corridors and habitat heterogeneity. Local conservation work to address current stresses and future threats is another important aspect of improving resilience: by working on known threats we can make ecosystems more able to withstand the unknown. Finally, as ecosystems and populations shift, resource management needs to adapt to these new realities rather than sticking to long-term plans.


PEATLANDS - CLIMATE MITIGATION:
Richardson et al. 2022 estimates the potential climate mitigation benefits of rewetting drained peatlands (specifically pocosin - a bog found in the SE US dominated by trees and/or shrubs). They measured water table depth, soil characteristics, dissolved organic carbon, and emissions of CO2 & methand & nitrous oxide at 5 sites (3 drained, 1 restored, 1 natural). The drained peatlands emitted a net of 21.2 t CO2e / ha (Table 2). They conducted additional detailed measurements on the drained peatlands, and combined the data into a model to predict how water table would impact emissions. Methane and nitrous oxide were excluded since CO2 was responsible for 98% of CO2e (Fig 3). Validation found the model to be conservative and w/in 18% of measurements out of the training sample. The pocosin always emit more carbon than they absorb in fall and winter, but re-wetting peat resulted in them being a net sink in spring and summer. Rewetting from a water table 60 cm deep tp 30 cm deep cut annual net emissions by 91% (abstract says 94% but see Table 2 for the correct numbers). Rewetting from to 20 cm deep switched the pocosoins from a carbon source to a sink, sequestering 3.3 t CO2e / ha / yr. Re-wetting also reduces the risk of peat fires which would increase emissions much more. Finally, Table 3 has their estimate of how much restorable peatlands (drained peatlands currently used for agriculture or forest plantations) could be re-wetted. Note that Evans et al. 2021 earlier found that raising the water table to these levels are likely to reduce crop yields (or require a switch to different crops and cultivars), but that raising the water level to the bottom of the root zone is a clear win-win.

Goldstein et al. 2020 looks at peat fires in Indonesia and what causes them, especially the sub-surface fires which cause the most air pollution and can burn for a long time. Their answer: it's complicated. They essentially find three requirements for sub-surface fires: 1) drainage lowers the water table and dries out the peat, 2) fire is ignited (for one of many reasons), and 3) enough fuel is present (like tree logs) that the fire burns long enough to reach deeper layers (dry weather also has a big influence). Much of the widespread use of fire does NOT result in these deep fires, b/c either the site isn't dry enough or it burns often enough there is insufficient fuel on the surface. The authors try hard not to blame anyone for these fires, but do argue that major drainage projects are likely a dominant factor.


REFERENCES:

Cook, B. I., Ault, T. R., & Smerdon, J. E. (2015). Unprecedented 21st century drought risk in the American Southwest and Central Plains. Science Advances, 1(1), 1–8. https://doi.org/10.1126/sciadv.1400082

Goldstein, J. E., Graham, L., Ansori, S., Vetrita, Y., Thomas, A., Applegate, G., Vayda, A. P., Saharjo, B. H., & Cochrane, M. A. (2020). Beyond slash‐and‐burn: The roles of human activities, altered hydrology and fuels in peat fires in Central Kalimantan, Indonesia. Singapore Journal of Tropical Geography, 41(2), 190–208. https://doi.org/10.1111/sjtg.12319

Halpern, B. S., Frazier, M., Verstaen, J., Rayner, P., Clawson, G., Blanchard, J. L., Cottrell, R. S., Froehlich, H. E., Gephart, J. A., Jacobsen, N. S., Kuempel, C. D., McIntyre, P. B., Metian, M., Moran, D., Nash, K. L., Többen, J., & Williams, D. R. (2022). The environmental footprint of global food production. Nature Sustainability. https://doi.org/10.1038/s41893-022-00965-x

Moore, J. W., & Schindler, D. E. (2022). Getting ahead of climate change for ecological adaptation and resilience. Science, 376(6600), 1421–1426. https://doi.org/10.1126/science.abo3608

Richardson, C. J., Flanagan, N. E., Wang, H., & Ho, M. (2022). Annual carbon sequestration and loss rates under altered hydrology and fire regimes in southeastern USA pocosin peatlands. Global Change Biology, July, 1–15. https://doi.org/10.1111/gcb.16366


Sincerely,
 
Jon
 
p.s. the photo was my attempt to make a Jack o 'lantern w/ bloodshot eyes

Monday, October 3, 2022

October 2022 science summary

Calli & Jon on porch

Greetings,


This month I am summarizing two science articles on climate change and one on conservation prioritization

If you know someone who wants to sign up to receive these summaries, they can do so at http://bit.ly/sciencejon (no need to email me).

CONSERVATION PRIORITIES:
Belote et al. 2021 is a great analysis comparing how different ways of identifying spatial conservation priorities overlap and conflict in the lower 48 states of the US. They focus on 4 groups of vertebrates (mammals, birds, amphibians, and reptiles), and 4 methods of prioritizing: species richness, rarity-weighted richness, and two Zonation approaches that favor complementarity / representation (ABF favors species richness, CAZ favors rarity). Fig 1 has the most interesting maps if you want to compare the approaches, and Fig 3 highlights the places with the most agreement across models that they are in the top 30% of options. It's a great way to see how your values and methods can affect your results (but also that some places are pretty agreed on priorities). Two things to contrast with the NatureServe "map of biodiversity importacet" - that analysis includes plants and some invertebrates (this does not), and NatureServe focuses on imperiled species while this is threat-blind. One last note on the zonation approaches - these work best as a complete set; if you pick and choose among them they don't perform nearly as well, and it's rare that science recommendations are ever taken up entirely. But conversely a focus solely on richness or rarity misses lower diversity ecosystems and wide-ranging species.


CLIMATE CHANGE:
Temmink et al. 2022 is an overview of carbon storage and cycling in wetlands. They note peatlands and coastal wetlands have much higher carbon stock density than forests or oceans, and also sequester more carbon each year (see the figure in the Review Summary for a nice overview, or Fig 1 for more detail). They also focus on how healthy wetlands have feedbacks that support high productivity and/or low decomposition (see Fig 2), but that people are disrupting those feedbacks. They show how much of these ecosystems have been lost already, and how fast they are disappearing (Table 1) and estimate this amoutns to 500 million metric tons of C lost each year. They closeby arguing that keeping wetlands intact is key for climate mitigation. One caution though - they focus only on carbon, and some wetlands emit quite a lot of methane and nitrous oxide. Those are much stronger GHGs than CO2, so the net climate benefit of wetlands is smaller than you'd think from looking at carbon alone.

Law et al. 2018 is an analysis of how more trees in Oregon (planting, cutting less often, and halting cutting) can lead to more climate mitigation benefits and cobenefits of water availability (maybe, stay tuned on that). From 2011-2015, OR forests already on net sequestered the equivalent of 72% of OR's total GHGs (Fig 2), and they think that could be boosted by 56% with a series of programs. See Figure 3 for this potential, but note the bars each represent a single decade (and the lower figure is annual change within that decade), with cumulative results from 2015-2100 showing up as numbers in italics OVER the bars. This confused me pretty thoroughly, and it looks to me from the Figure like annual "net ecosystem carbon balance" (~=net carbon sequestered) by 2100 would increase by ~1.2 Tg C / yr, not the 2-3 they say in the text. They also find that using harvest residues for bioenergy would lead to a net increase in emissions (even assuming 1/2 of residues replace coal or natural gas). One thing that struck me as very odd: they propose afforesting grass crops which are irrigated but not used for food or forage, and claiming water will be freed up by doing so. But I can't figure why someone would irrigate grass if it wasn't used for food (or things like lawns or golf courses which forests wouldn't be compatible with)- maybe it's literally fields to produce grass seed sold for lawns?
Peter Ellis from TNC had this take which I found helpful (that this shouldn't be taken as having national implications): "The study is constrained to the Pacific Northwest (PNW). If you care about carbon, you can never really beat leaving a PNW forest alone. No attempts to sell the idea of mitigation through bioenergy or wood product storage are going to beat carbon storage in forests in a region where: 
•    Trees are largest in the world
•    They take forever to decompose, so coarse woody debris storage is really important.
Their proposal for Oregon’s forest actually makes a lot of sense to me: 'reforestation, afforestation, lengthened harvest cycles on private lands, and restricting harvest on public lands increased net ecosystem carbon balance by 56% by 2100'"

REFERENCES:

Belote, R. T., Barnett, K., Dietz, M. S., Burkle, L., Jenkins, C. N., Dreiss, L., Aycrigg, J. L., & Aplet, G. H. (2021). Options for prioritizing sites for biodiversity conservation with implications for “30 by 30.” Biological Conservation, 264, 109378. https://doi.org/10.1016/j.biocon.2021.109378

Law, B. E., Hudiburg, T. W., Berner, L. T., Kent, J. J., Buotte, P. C., & Harmon, M. E. (2018). Land use strategies to mitigate climate change in carbon dense temperate forests. Proceedings of the National Academy of Sciences, 115(14), 3663–3668. https://doi.org/10.1073/pnas.1720064115

Temmink, R. J. M., Lamers, L. P. M., Angelini, C., Bouma, T. J., Fritz, C., van de Koppel, J., Lexmond, R., Rietkerk, M., Silliman, B. R., Joosten, H., & van der Heide, T. (2022). Recovering wetland biogeomorphic feedbacks to restore the world’s biotic carbon hotspots. Science, 376(6593). https://doi.org/10.1126/science.abn1479


Sincerely,
 
Jon
 
p.s. This is a recent picture of me and my neighbor's adorable snaggletoothed dog Calli on our porch (we were dogsitting).

Thursday, September 1, 2022

September 2022 science summary

Goldfinches on cutleaf coneflowers

Hi,


First I wanted to say how sorry I was to hear that one of the lead authors I highlighted last month (Jonathan Higgins) has since passed away. Higs was a force of nature and he will be missed by many. I'm very glad that my last email exchange with him was about how useful his paper was and the impact I thought it would have, which made him very happy.

This month I am summarizing three articles on climate change, one on tropical forest recovery, and one on conservation and human well-being. If you know someone who wants to sign up to receive these summaries, they can do so at http://bit.ly/sciencejon (no need to email me).


CLIMATE CHANGE:
Gopalakrishna et al. 2022 highlights the need for local studies of climate mitigation potential. They found that if you avoid conflict w/ ag lands, forest restoration potential is lower in India than global estimates (and they suspect the same would be true in other tropical countries with lots of ag lands). They found 1.6 million ha of lands that could be restored; the plurality was degraded forest followed by scrub. If those lands were restored, they estimate it could provide 61.3 Mt (million tons) of carbon sequestration. They also roughly estimate 14.7 million ha of ag lands could incorporate agroforestry practices for up to another 98 Mt of carbon over 30 years. So the key take-aways here are a) we can't rely on global estimates for in-country work and b) if we can find ways to add trees to lands producing food w/o impacting food production (which is sometimes possible) there is a lot of opportunity there.

Noon et al. 2022 is a fantastic resource mapping global priority habitats for conservation to protect and/or manage to slow climate change. They focus on "irrecoverable carbon" - meaning carbon that will take 30+ years to recover after it is lost due to conversion or degradation. Fig 1 has a global map of irrecoverable carbon with a few hotspots highlighted (or use this web map which has slightly different symbology https://irrecoverable.resilienceatlas.org/map). But more useful is Fig 2 which splits out the carbon by how it's threatened (by land conversion, climate change, both, or neither) to identify where protection vs. management makes sense. Note that in Fig 2 darker colors mean more carbon within each of the four risks, but they are not consistent across the four risks (to see the highest total carbon you still need Fig 1). Fig 3 highlights how uneven irrecoverable carbon in, 50% of it is in just 3% of global land area! If you work on carbon in nature, read the whole paper. Many thanks to the authors who kindly answered my questions and sent me their data so I could make my own maps!

Reed 2021 tackles the thorny issue of how montane meadowns in California (wet grasslands in mountains) mitigate or worsen climate change. They found that a) these ecosystems store a lot of carbon, b) on net they can be either a big carbon source (10/13 sites) or a big carbon sink (3/13 sites) c) the sites that were a source had similar plant species to sink sites, but typically had groundwater closer to the surface, more root biomass, and less bare ground, d) methane emissions were consistently low, and e) they're not sure what caused most meadows to become net carbon sources (the high carbon stock indicate they all used to be sinks) but think it depends mostly on how much water and dissolved carbon flows into the meadows from uplands and thus upland forest loss is a likely culprit. The discussion is interesting - they hypothesize that hydrologic restoration in the meadow and upland forest management could slow carbon losses but think it's a safer bet to try and maintain sites that are currently net carbon sinks.


FOREST RESILIENCE / RECOVERY:
Poorter et al. 2021 look at how long it took for tropical forests (in Central & South America plus West Africa) to recover after deforestation, finding them pretty resilient. They found recovery to 90% of old growth values took 1-9 yrs for soil, plant function took 3-27 yrs, forest structure took 27-119 (tree size variation 27, max tree size 49, biomass 119), species diversity took 37-59, and species composition took 120 years. They thus argue secondary (regrowing) forests are still ecologically important and deserve conservation (protection, restoration, and management). Note that most of their sites had low to mid intensity land use after deforestation like swidden agriculture, so soil degradation was relatively minor. It's short and worth the read, but as is common w/ papers in Science I found the figures hard to decipher but useful once you put in the time. Fig 1B shows roughly how quickly different attributes recover over time (soil is brown, plant function is purple, structure is green, and diversity is turquoise); Fig 2 is similar but breaks out sub-indicators and is more precise; and Fig 3D is my favorite (how long it takes each attribute to return to 90% of old growth values). Here are the abbreviations since they are not defined in a single place! 
AGB=aboveground biomass
BD=soil bulk density
C=soil carbon
DMAX=maximum tree diameter
N=soil nitrogen
NF=proportional basal area of nitrogen-fixing species
SC=species composition (how similar abundance of each species is to old growth)
SD=Simpson diversity (~diversity of common species)
SH=structural heterogeneity (variation in tree size)
SR=species richness (number of species present)
SLA=community-weighted mean specific leaf area
WD=community-weighted mean wood density


NATURE & PEOPLE:
Huynh et al. 2022 is a global literature review of 300 peer-reviewed papers on the many intangible ways nature impacts people (what they call "cultural ecosystem services" or CESs). So it leaves out physical effects like providing food, clean water, reducing storms, etc. (which are well studied) and focuses on things like recreation, spiritual fulfillment, aesthetics, etc. If you enjoy taxonomies / classifications you will like this paper, and if not, you will find it a slog, since the heart of it is a framework to classify many ways people and nature interact (see Table 1 and Figure 2). But it's worth at least reading through Table 1 and pondering a bit. Ssome like how nature can help people bond ('Cohesive') were new to me but rang true; others felt like splitting hairs (e.g., splitting spiritual experiences into 'Intuitive' and 'Transcendentive'). Beyond the framework, they found 86% of over 1,000 observations positively impacted people (more studies looked at this and there is likely bias in the lit - it's not necessarily that nature is inherently overwhelmingly beneficial). Their expert judgment is that the biggest benefits come from mental and physical health, particularly from recreation (including tourism) and aesthetic values (the size of boxes in Fig 3 shows how many studies they had for each of 227 'pathways').The biggest negative impacts came from concern about safety ('Apprehensive'), or the loss of ecosystem services when nature is damaged or lost ('Destructive' - although it seems odd to me to mix that in with actual harms from nature itself), with only a few 'Irritative' (annoyance or disgust, e.g., from wildlife noise or excrement). In the end the paper gave me 'Cognitive' benefits but was not very 'Satisfactive.' The Washington Post has an overview of the paper here: https://www.washingtonpost.com/climate-solutions/2022/08/05/nature-study-impact-hiking-outdoors/


REFERENCES:

Gopalakrishna, T., Lomax, G., Aguirre‐Gutiérrez, J., Bauman, D., Roy, P. S., Joshi, P. K., & Malhi, Y. (2022). Existing land uses constrain climate change mitigation potential of forest restoration in India. Conservation Letters, December 2021, 1–11. https://doi.org/10.1111/conl.12867

Huynh, L. T. M., Gasparatos, A., Su, J., Dam Lam, R., Grant, E. I., & Fukushi, K. (2022). Linking the nonmaterial dimensions of human-nature relations and human well-being through cultural ecosystem services. Science Advances, 8(31), 1–22. https://doi.org/10.1126/sciadv.abn8042

Noon, M. L., Goldstein, A., Ledezma, J. C., Roehrdanz, P. R., Cook-Patton, S. C., Spawn-Lee, S. A., Wright, T. M., Gonzalez-Roglich, M., Hole, D. G., Rockström, J., & Turner, W. R. (2022). Mapping the irrecoverable carbon in Earth’s ecosystems. Nature Sustainability, 5(1), 37–46. https://doi.org/10.1038/s41893-021-00803-6

Poorter, L., Craven, D., Jakovac, C. C., van der Sande, M. T., Amissah, L., Bongers, F., Chazdon, R. L., Farrior, C. E., Kambach, S., Meave, J. A., Muñoz, R., Norden, N., Rüger, N., van Breugel, M., Almeyda Zambrano, A. M., Amani, B., Andrade, J. L., Brancalion, P. H. S., Broadbent, E. N., … Hérault, B. (2021). Multidimensional tropical forest recovery. Science, 374(6573), 1370–1376. https://doi.org/10.1126/science.abh3629

Reed, C. C., Merrill, A. G., Drew, W. M., Christman, B., Hutchinson, R. A., Keszey, L., Odell, M., Swanson, S., Verburg, P. S. J., Wilcox, J., Hart, S. C., & Sullivan, B. W. (2021). Montane Meadows: A Soil Carbon Sink or Source? Ecosystems, 24(5), 1125–1141. https://doi.org/10.1007/s10021-020-00572-x


p.s. the photo shows a goldfinch amidst my cutleaf coneflowers, watching me watch him (these flowers are only ~5 ft from a living room window)

Monday, August 1, 2022

August 2022 science summary

Bubble in garden

Hi,

After publishing no peer-reviewed science in 2021, two papers I'm a co-author on were published this month!

The first (Vijay et al. 2022) looks at how different conservation goals for people and nature tend to align and conflict: identifying both win-wins and trade-offs to inform conservation priorities. The second (James et al. 2022) is an analysis of scientific publications by staff at The Nature Conservancy split by gender, along with recommendations to improve the ability of women (especially from the Global South) to publish research. Let me know if you have questions about either after reading the summaries below!

I've also got an interesting article on the IUCN Red List of threatened ecosystems, and a great framework to think through freshwater conservation needs and approaches.

If you know someone who wants to sign up to receive these summaries, they can do so at http://bit.ly/sciencejon (no need to email me).

GENDER AND SCIENCE:
James et al. 2022 analyzed almost 3,000 peer-reviewed scientific publications with at least one author from The Nature Conservancy (TNC) by gender of the author(s) - all that we could find from 1968 to 2019. Roughly 1/3 of the TNC authors and authorships (# authors * # papers) were women, even though 45% of conservation and science staff are women. Most authorships were in the U.S. - 85% overall and 90% for women. This means men (especially men in the United States) are publishing at a significantly higher rate than women. We close with several recommendations to help shrink this gap. Some are aimed at individual scientists (e.g., self-education on bias and systemic barriers, asking men to collaborate more with women as male-led papers have far fewer women co-authors than female-led papers, and asking lead authors to be more inclusive in determining whose contributions merit being listed as an author), and others are aimed at organizations (e.g., providing more resources and support for women who wish to publish, especially for women who don't speak English as a first language). I learned a ton from both the data and my co-authors on this one, and we have another 1-2 papers on the subject coming which will get into the results of a survey the lead author did to get deeper into the experience of how gender impacts not only publication but perceptions of influence and career advancement. Note that our available data listed everyone's gender as male, female, or unknown - apologies to those who we misgendered or otherwise failed to reflect their lived experience with a relatively simple binary analysis (especially as gender diverse people appear to be even more underrepresented in science publications).
You can read blogs about the article at https://www.nature.org/en-us/newsroom/published-science-gender-gap/ and https://blog.nature.org/science/science-brief/conservation-science-publishing-has-a-gender-problem/


CONSERVATION PRIORITIZATION:
As conservation organizations try to work towards multiple goals, Vijay et al. 2022 asks whether we can protect places that efficiently advance multiple goals at once, or if we have to pick between places good for one goal but that perform poorly for others. We looked at opportunities to advance five benefits by protecting land in the contiguous United States: vertebrate species richness, threatened vertebrate species richness, carbon storage, area protected, and recreational usage. Specifically we looked at Return On Investment (ROI) meaning the benefit score compared to the cost of the land (as a proxy for difficulty of protecting it). The results are a bit complicated: this paper focused only on unprotected habitat which is predicted to be converted by 2100, and with that framing the four environmental benefits were both highly correlated overall (r 0.89-0.99) and had a lot of the "top sites" in common (the highest scoring places for one benefit often had a top score for another benefit, 32-79% of the time). Recreation had less in common with environmental benefits (r 0.5-0.52, only 7-13% of the top sites were also a top site for another benefit). That still shows a lot of opportunity for win-wins across the nation! However, if you DON'T constrain conservation to places where land use is projected to change by 2100, win-wins are harder to find (as shown in the Supplementary Information). Species richness and area were the most compatible with a high r of 0.58 and 24% of top sites in common, and area and recreation were the least aligned, with an r of -0.65 and no top sites in common. There's a lot of interesting stuff in the paper (including comparing how three hypothetical policy scenarios score on each benefit), and I've written a slightly longer summary here: https://www.linkedin.com/posts/sciencejon_conservation-science-goalsetting-activity-6948122284528197632-OH0S/

You're probably familiar with the IUCN's Red List of Threatened Species - which ranks how at risk species around the world are. Comer et al. 2022 is an analysis for the Red List of ECOSYSTEMS for North America - looking at the risk of ecological collapse for 655 terrestrial ecosystems considering: current extent, how much historic extent has been lost, degradation from historic fire regime, and disruption of biotic processes (focused on invasive species and landscape fragmentation). They found 1/3 of ecosystems were threatened, and Fig 2 shows which types of ecosystems were the most threatened (like Mediterranean Scrub & Grassland, which had the highest % of extent that was threatened, and Tropical Montane Grassland & Shrubland, which had the highest % Critically Endangered). Fig 1 has a great pair of maps showing both current and historic extent of all assessed ecosystems (colored by threat level). There is also an excellent discussion of the challenges and limitations in doing an analysis like this (section 4.2). Despite these limitations, this provides a useful complement to species-focused prioritizations (like range-size rarity).


FRESHWATER CONSERVATION:
Higgins et al. 2021 (from a team of scientists and lawyers) argues that since freshwater species are declining faster than terrestrial species, and effective durable freshwater conservation is typically harder to get right, we need more thoughtful design of freshwater protection and management. They offer a framework to do that, beginning with key questions (about things like what you value, key ecological attributes [KEAs] to conserve, threats to ecosystems, and protection options), which is summarized in Figure 1. Table 1 is extremely useful: it outlines 5 key ecological attributes that freshwater systems need: 1) hydrologic regime / healthy flow, 2) connectivity , 3) water quality (nutrients, sediment, toxins, etc.), 4) habitat (riparian, in-stream, other wetlands), 5) species (diversity, abundance, invasives). Table 1 also lists threats, Table 2 has conservation options, and Table 3 has helpful and relatively simple examples to get you started. Doing this work is hard! But I found this article to be a great challenge to keep thinking beyond protecting the land around freshwater ecosystems, and planning for what they need over the long-term.

REFERENCES:

Comer, P. J., Hak, J. C., & Seddon, E. (2022). Documenting at-risk status of terrestrial ecosystems in temperate and tropical North America. Conservation Science and Practice, 4(2), 1–13. https://doi.org/10.1111/csp2.603

Higgins, J., Zablocki, J., Newsock, A., Krolopp, A., Tabas, P., & Salama, M. (2021). Durable Freshwater Protection: A Framework for Establishing and Maintaining Long-Term Protection for Freshwater Ecosystems and the Values They Sustain. Sustainability, 13(4), 1950. https://doi.org/10.3390/su13041950

James, R., Ariunbaatar, J., Bresnahan, M., Carlos‐Grotjahn, C., Fisher, J. R. B., Gibbs, B., Hausheer, J. E., Nakozoete, C., Nomura, S., Possingham, H., & Lyons, K. (2022). Gender and conservation science: Men continue to out‐publish women at the world’s largest environmental conservation non‐profit organization. Conservation Science and Practice, January, 1–9. https://doi.org/10.1111/csp2.12748

Vijay, V., Fisher, J. R. B., & Armsworth, P. R. (2022). Co‐benefits for terrestrial biodiversity and ecosystem services available from contrasting land protection policies in the contiguous United States. Conservation Letters, February, 1–9. https://doi.org/10.1111/conl.12907


Sincerely,
 
Jon
 
p.s. This large bubble is over my 'butterfly garden' which is currently full of flowers and pollinators!

Wednesday, July 6, 2022

Two new papers: how gender impacts science publishing & conservation prioritization

After having 0 papers published in 2021, I was on author on two papers published last week (both open access - click the author name to go to the paper)! Here's a quick summary of each:

James et al. 2022 analyzed almost 3,000 peer-reviewed scientific publications with at least one author from The Nature Conservancy (TNC) by gender of the author(s) - all that we could find from 1968 to 2019. Roughly 1/3 of the TNC authors and authorships (# authors * # papers) were women, even though 45% of conservation and science staff are women. Most authorships were in the U.S. - 85% overall and 90% for women. This means men (especially men in the United States) are publishing at a significantly higher rate than women. We close with several recommendations to help shrink this gap. Some are aimed at individual scientists (e.g., self-education on bias and systemic barriers, asking men to collaborate more with women as male-led papers have far fewer women co-authors than female-led papers, and asking lead authors to be more inclusive in determining whose contributions merit being listed as an author), and others are aimed at organizations (e.g., providing more resources and support for women who wish to publish, especially for women who don't speak English as a first language). 

I learned a ton from both the data and my co-authors on this one, and we have another 1-2 papers on the subject coming which will get into the results of a survey the lead author did to get deeper into the experience of how gender impacts not only publication but perceptions of influence and career advancement. Note that our available data listed everyone's gender as male, female, or unknown - apologies to those who we misgendered or otherwise failed to reflect their lived experience with a relatively simple binary analysis (especially as gender diverse people appear to be even more underrepresented in science publications).

You can read blogs about the article at https://www.nature.org/en-us/newsroom/published-science-gender-gap/ and https://blog.nature.org/science/science-brief/conservation-science-publishing-has-a-gender-problem/ or the full paper is at https://onlinelibrary.wiley.com/doi/10.1111/csp2.12748


As conservation organizations try to work towards multiple goals, Vijay et al. 2022 asks whether we can protect places that efficiently advance multiple goals at once (win-wins), or if we have to pick between places good for one goal but that perform poorly for others (trade-offs). We looked at opportunities to advance five benefits by protecting land in the contiguous United States: vertebrate species richness, threatened vertebrate species richness, carbon storage, area protected, and recreational usage. Specifically we looked at Return On Investment (ROI) meaning the benefit score compared to the cost of the land (as a proxy for difficulty of protecting it). 

The results are a bit complicated: this paper focused only on unprotected habitat which is predicted to be converted by 2100, and with that framing the four environmental benefits were both highly correlated overall (r 0.89-0.99) and had a lot of the "top sites" in common (the highest scoring places for one benefit often had a top score for another benefit, 32-79% of the time). Recreation had less in common with environmental benefits (r 0.5-0.52, only 7-13% of the top sites were also a top site for another benefit). That still shows a lot of opportunity for win-wins across the nation! However, if you DON'T constrain conservation to places where land use is projected to change by 2100, win-wins are harder to find (as shown in the Supplementary Information). Species richness and area were the most compatible with a high r of 0.58 and 24% of top sites in common, and area and recreation were the least aligned, with an r of -0.65 and no top sites in common. 

There's a lot of interesting stuff in the paper (including comparing how three hypothetical policy scenarios score on each benefit), and I've written a slightly longer summary here: https://www.linkedin.com/posts/sciencejon_conservation-science-goalsetting-activity-6948122284528197632-OH0S/ or the full paper is at https://onlinelibrary.wiley.com/doi/10.1111/conl.12907

Friday, July 1, 2022

July 2022 science summary

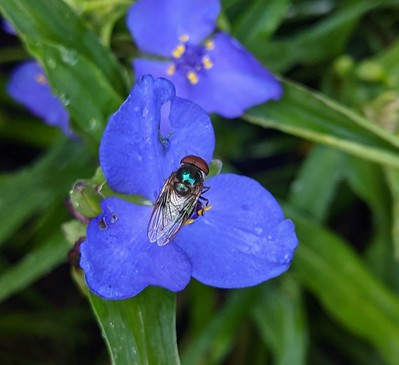
Bromeliad fly (Copestylum) on spiderwort (Tradescantia)

Hello,


This month is another grab bag: one paper on equity in fire management, two on biodiversity data, one asking how much conservation has helped species, and one pretty bad one on how ag practices impact nutrients.

If you know someone who wants to sign up to receive these summaries, they can do so at http://bit.ly/sciencejon (no need to email me).

FIRE MANAGEMENT:
Anderson et al. 2020 found that rich white communities who had a fire nearby tend to get additional prescribed fire (even when not needed). This is partly due to their ability to self-advocate at relevant planning meetings. It raises equity and social justice concerns about how we could instead base fire management on factors like social and/or ecological vulnerability. As context, here is a map showing how wildfire risk varies across the U.S.: https://www.nytimes.com/interactive/2022/05/16/climate/wildfire-risk-map-properties.html


BIODIVERSITY DATA:
Saran et al. 2022 has a good overview of biodiversity information portals, 16 global (Table 1) and 5 country-specific (from Australia, Canada, India, and the U.S., Table 2). It's a great complement to Nicholson et al. 2021 (an overview of ecosystem indicators) by providing actual data sources and some info about what each portal includes. The paper certainly isn't "comprehensive" as the title advertises, but it's a great start and I learned about some new useful resources by reading it.

Before threatened species can get protection, they need to be assessed to document how vulnerable they are. But there is a substantial backlog of species waiting to be assessed. Levin et al. 2022 offers a fairly simple (but ultimately unsuccessful) way to re-prioritize unassessed species for the IUCN red list to allow a better chance of assessing the ones that are in trouble so they can get protection. They use a rapid estimate of "extent of occurrence" (the species' range and spatial distribution of threats) as a proxy for vulnerability. At first it's exciting to see that it was 92% accurate at identifying which species were of the Least Concern (showing potential to flag species not worth assessing). But two questions are more relevant (and Fig 1 has the answers): what % of vulnerable species does it correctly recommend assessing (40%) and what % of recommendations for assessment are for species that are actually vulnerable (23%). The discussion has interesting notes on some of the aspects that confused the model (like 5 ash app threatened by Emerald Ash Borer and the American Chestnut threatened by blight) - widespread spp. hit hard by invasives are challenging to accurately assess using simple approaches like this. Hopefully the next iteration of the tool will be more successful, if they could substantially reduce false negatives for vulnerable species it could provide assessment priorities directly, or if they could substantially reduce false positives for vulnerable species it could help by indicating species that likely shouldn't be assessed.


CONSERVATION IMPACT:
Jellesmark et al. 2022 is a global (see Fig 1 map) preprint looking at how conservation has impacted targeted vertebrate species (by comparing pairs of populations targeted for conservation with those in the same country that did not receive conservation attention). I honestly don't know enough about the underlying data source (Living Planet Database) to speak to the reliability of their results (I'll wait for peer review for that, there is at least one very important typo where they use "invertebrate" when they clearly mean "vertebrate"). They found that population size of assessed vertebrates dropped 24% over 46 years, but estimate that without conservation it would have dropped 32% (and this likely underestimates the impact of conservation). They split out conservation actions into 7 groups (land/water protection, land/water mgmt, species mgmt, education/awareness, law/policy, livelihoods/incentives, and external capacity building), and capacity building followed by the first three showed the strongest results (Fig 5).


SUSTAINABLE AGRICULTURE:
Montgomery et al. 2022 asks how nutrients from ‘regenerative’ farms (that use no-till, crop  rotations, and cover crops) differ from other farms, but I wouldn't recommend it. This paper is pretty weak methodologically, results were inappropriately highlighted and over-interpreted, and the results I initially planned to write about didn’t hold up when I looked at raw data. Some key caveats: it is a very small sample size, 4/5 authors have financial interests the paper furthers, only one author appears to be a scientist (a geomorphologist), and the methods are thin and read like they may have gone looking for pairs of farms that would support the desired narrative (plus they used a very rough method to measure organic matter). At first I thought the most interesting / meaningful results are for cabbage: 10 assessed nutrients were substantially higher on regenerative farms, compared to 4 that were the same, 4 that were substantially lower, and 3 not assessed. But when you dive in, that 70% difference in vitamin E is from 0.004 to 0.007 mg/100g (essentially nil). Ditto with wheat results, 50% more calcium than “almost none” is still almost none. The animal results are hard to interpret because they don’t provide enough detail on differences between ‘regenerative’ vs. ‘conventional’ (although findings that grass-finished beef have more nutrient content have been reported in other lit, in alignment w/ results here). Some results look more meaningful (20% more vitamin C in cabbage is worthwhile) but there is such variation in the soil organic matter and soil health across the farms it’s really hard to know what is significant and what is accidental. One last note - 'regenerative' here almost certainly means 'genetically modified’ for most crops, since it’s hard to do no-till without them.


REFERENCES:

Anderson, S., Plantinga, A., & Wibbenmeyer, M. (2020). Inequality in Agency Responsiveness: Evidence from Salient Wildfire Events (Issue December). https://www.rff.org/publications/working-papers/inequality-agency-responsiveness-evidence-salient-wildfire-events/

Jellesmark, S., Blackburn, T. M., Dove, S., Geldmann, J., Visconti, P., Gregory, R. D., McRae, L., & Hoffmann, M. (2022). Assessing the global impact of targeted conservation actions on species abundance. BioRxiv, 2022.01.14.476374. https://doi.org/10.1101/2022.01.14.476374

Levin, M. O., Meek, J. B., Boom, B., Kross, S. M., & Eskew, E. A. (2022). Using publicly available data to conduct rapid assessments of extinction risk. Conservation Science and Practice, November 2020, 1–9. https://doi.org/10.1111/csp2.12628

Montgomery, D. R., Biklé, A., Archuleta, R., Brown, P., & Jordan, J. (2022). Soil health and nutrient density: preliminary comparison of regenerative and conventional farming. PeerJ, 10, e12848. https://doi.org/10.7717/peerj.12848

Saran, S., Chaudhary, S. K., Singh, P., Tiwari, A., & Kumar, V. (2022). A comprehensive review on biodiversity information portals. Biodiversity and Conservation, 0123456789. https://doi.org/10.1007/s10531-022-02420-x

Sincerely,
 
Jon
 
p.s. This photo is of what I think is a bromeliad fly (Copestylum) on a Tradescantia flower in my garden. First time I have seen one!

Wednesday, June 1, 2022

June 2022 science summary

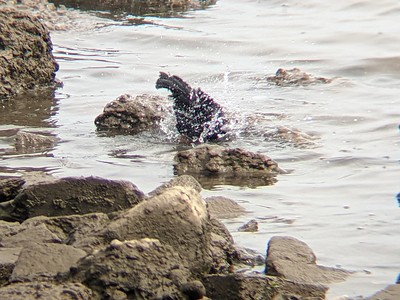
Red-winged blackbird

Greetings,


This month I only have three science articles but they're all good'uns.

If you know someone who wants to sign up to receive these summaries, they can do so at http://bit.ly/sciencejon (no need to email me).

PROTECTED AREAS:
Sullivan-Stack et al. 2022 is a great summary of marine protected areas (MPAs) in the U.S., and flags that achieving 30% U.S. ocean protection by 2030 is not on track to provide sufficient benefit to marine ecosystems. The key finding that stood out to me was the need for improving both geographic representation and efficacy / strength of protection (as well as climate resilience and equity). U.S. oceans are 26% protected overall (25% fully or highly protected), but 96% of that is in the central Pacific ocean. Excluding that region, only 2% has any protection (and only 22% of that 2% is fully or highly protected). See Table 3 for a summary of how much of each region is protected and at what level (Figure 1 has a map but it's not split by protection strength). Alaska has the lowest % protection of any kind (0.7%) while OR & WA have the weakest protection (4.2% of ocean is protected, but that's all minimal protection). Skip to section 4 for their recommendations: create more effective MPAs (via new ones and strengthening existing ones), improve representation of different marine regions & species & habitats in well-connected MPAs, improve equity & access, go beyond tracking % coverage and include impact assessments, make MPAs durable and climate resilient, coordinate state MPAs, reinstate and empower the MPA Federal Advisory Committee, strengthen & fund the NOAA MPA Center, and update the U.S. National Ocean Policy for holistic ocean planning and management.


ECOSYSTEM INDICATORS:
Nicholson et al. 2021 is chock full of useful diagrams and lists. They have a number of recommendations for setting ecosystem goals (which have milestones, targets, and indicators) for a global biodiversity framework, but which can be relevant to other efforts (like 30x30). At a high level they flag the need to track not only total ecosystem/habitat area (or extent), but also changes in ecosystem integrity (including the risk of ecosystem collapse - see Box 2 for definitions). Fig 2 is a nice visual summary of how different types of targets can collectively capture different threats and ecosystem attributes that need to be addressed for long term ecosystem health. Fig 3 is a super helpful review of many different environmental indices / metrics, and what aspects of ecosystems they include and omit. Spend some time with that one - even learning about all of the indices was very helpful for me. They close with 6 recommendations for picking indicators: we need a set of them (no single one suffices), they need to reflect goals (not actions), relevance to the goal is at least as important as data availability, we need more testing and validation of indicators, we need stronger connections between global indicators and national or local policies, and we need new indicators to provide early warning of ecosystem collapse.


ECOSYSTEM CONDITION:
There are good remote sensing data for land cover change, worse but decent data for land use change, but generally not much on degradation (which means we can underestimate ecological decline). Swaty et al. 2021 describe a "Vegetation Departure" (VDEP) spatial data set for the US which gets at this. This includes whether early or late successional stages are over-represented or under-represented (think of a logged forest w/ no old growth left but plenty of young forest, or a grassland being taken over by denser shrubs which were historically less common). They highlight several limitations of the existing LANDFIRE VDEP data (which focuses on canopy cover and height), and recommend that users consider other attributes that are important to their ecosystems of interest (e.g., biodiversity, wildlife populations, wildfire risk, etc.).


REFERENCES:

Nicholson, E., Watermeyer, K. E., Rowland, J. A., Sato, C. F., Stevenson, S. L., Andrade, A., Brooks, T. M., Burgess, N. D., Cheng, S.-T., Grantham, H. S., Hill, S. L., Keith, D. A., Maron, M., Metzke, D., Murray, N. J., Nelson, C. R., Obura, D., Plumptre, A., Skowno, A. L., & Watson, J. E. M. (2021). Scientific foundations for an ecosystem goal, milestones and indicators for the post-2020 global biodiversity framework. Nature Ecology & Evolution, 5(10), 1338–1349. https://doi.org/10.1038/s41559-021-01538-5

Sullivan-Stack, J., Aburto-Oropeza, O., Brooks, C. M., Cabral, R. B., Caselle, J. E., Chan, F., Duffy, J. E., Dunn, D. C., Friedlander, A. M., Fulton-Bennett, H. K., Gaines, S. D., Gerber, L. R., Hines, E., Leslie, H. M., Lester, S. E., MacCarthy, J. M. C., Maxwell, S. M., Mayorga, J., McCauley, D. J., … Grorud-Colvert, K. (2022). A Scientific Synthesis of Marine Protected Areas in the United States: Status and Recommendations. Frontiers in Marine Science, 9(May), 1–23. https://doi.org/10.3389/fmars.2022.849927

Swaty, R., Blankenship, K., Hall, K. R., Smith, J., Dettenmaier, M., & Hagen, S. (2021). Assessing Ecosystem Condition: Use and Customization of the Vegetation Departure Metric. Land, 11(1), 28. https://doi.org/10.3390/land11010028


Sincerely,
 
Jon
 
p.s. The photo above is of a red-winged blackbird bathing in the Potomac River at Dyke Marsh

Monday, May 2, 2022

May 2022 science summary

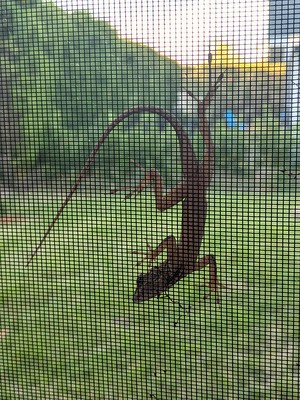
Lizard on a porch screen

Greetings,


This month I have a few science articles on freshwater, two on climate change and forest management, and one big one on biodiversity.

If you know someone who wants to sign up to receive these summaries, they can do so at http://bit.ly/sciencejon (no need to email me).

BIODIVERSITY:
Hamilton et al. 2022 is the latest analysis from NatureServe on biodiversity in the U.S., and potential priorities for new protection. They looked at habitat for 2,216 imperiled species (G1 or G2 globally, or Threatened or Endangered nationally) across the U.S., including often overlooked species like plants and bugs. There are several interesting methodological advances here (relatively fine 1-km pixels, inclusion of overlooked species, using both range maps and habitat suitability models and showing how that changes results in Fig 4, etc.), but I think most readers will want to focus on implications for new protections and management of existing protected areas. Fig 2 shows the most important areas to protect. They use protection-weighted range-size rarity, which is a kind of rarity-weighted richness focusing on places with a) relatively high # of species that b) have relatively little habitat left nationally. Table 2 has a nice summary of how many species have the majority of their habitat managed by different groups (federal agencies, state & local, private), showing there is a lot of potential for management on existing public lands (since 43% of imperiled species have most of their habitat on public lands). It's worth reading the whole thing, but if short on time I recommend the NY Times article about this and especially the interactive maps of their data.


CLIMATE CHANGE / FOREST MANAGEMENT:
Littlefield and D'Amato 2022 looks at trade-offs between maximizing forest carbon and maximizing biodiversity and habitat quality. In particular, they note that many species require disturbance (like fire or tree removal), while maximizing carbon generally involves promoting uniformly dense and mature trees. They note that robust data looking at how different species respond to forest management are surprisingly scarce, but offer several case studies where as tree biomass increased, wildlife abundance and/or diversity has declined. They recommend that conservation planning consider climate adaptation, which means keeping landscape diversity, complexity, and connectivity (accepting that means some reduction in potential carbon), and that we explicitly discuss and recognize trade-offs where they exist.

Stephenson et al. 2014 is a global analysis of how carbon sequestration by 403 tree species change as they grow and age. 87% of tree species sequester more annual carbon per year as they get bigger (even when they get huge). On average a 1m diameter tree sequesters about triple the carbon as a 1/2m diameter tree (similar to the trunk cross-section ration of 4:1). The biggest trees can add ~0.55-0.72 t biomass (not C, which would be much lower) per year (Fig 3). However, they note that at the forest level, as an even-aged stand gets older the annual carbon sequestered per land area goes down (as trees die, total sequestration declines despite remaining big trees sequestering more. Ideally forest management should think about 1) impacts on carbon pools (how much harvested tree biomass will be lost to the atmosphere), 2) impacts on carbon sequestration, and 3) impacts on forest ecology (both mature / older trees, and disturbances and younger trees have important roles).


FRESHWATER:
Broadley et al. 2022 is a global assessment (although w/ ~1/4 of studies coming from the US) of how marine fishery productivity (including invertebrates) depends on rivers. Their headline finding is that 72% of 276 fished species (77% of global catch by mass) are linked to river flows at some point in their life cycle, and 83% eat food linked to river flows. The biggest link is occasionally going to estuaries to eat (77% of species) as opposed to diadromous or estuarine-dependent species (23% of species), see Fig 5 for a map of where they're distributed. They also offer a conceptual review of how rivers influence fisheries by focusing on science literature for the top 10 fishery species by catch mass. They conclude that rivers influence fisheries via physical changes (flow quantity, timing, and quality [sediment, nutrients, salinity, temperature, etc.]), biological response of marine species to those physical changes (e.g. nutrients from a river increasing algae which zooplankton and fish respond to, changes in spawning in response to freshwater mixing, migration, etc.), and changes in fisher behavior and fishery productivity resulting from those biological changes (see Table 1). They recommend an integrated planning approach to rivers (including dam management) and marine fisheries.

Pennock et al. 2022 makes a case that rivers with relatively natural flow regimes should be priorities for conservation (specifically protection that limits consumptive water use or otherwise alters flow). They look at four tributaties of the Green River (which feeds the Colorado River): the White, Price, San Rafael, and Duchesne Rivers. Only the White River has a relatively natural flow regime (although median spring discharge is still down 25% relative to before 1949, and summer baseflow by 29%), and spring flow in the Duchesne and San Rafel are down ~80%. That drop in flow accompanies habitat degraded in several ways: less large woody debris, narrower channels, less regeneration of cottonwoods, loss of native fish spp, etc. They also point out that even dams managed for environmental flow has fallen well short of natural flood regimes.

Maasri et al. 2022 is a new global freshwater research agenda. They have 15 recommendations in 5 themes: 1) Data infrastructure (compile and integrate data sources on freshwater biodiversity, mobilize and share existing data w/ stakeholders, and develop accessible databases), 2) Monitoring (coordinate existing FW biodiversity monitoring and move towards global consistency, expand monitoring to places and species currently overlooked [like fungi and protists], and develop new monitoring methods [like eDNA, remote sensing, citizen science, etc.]), 3) Ecology (better understand how biodiversity relates to ecosystem health and services, study how biodiversity responds to multiple stressors, and study species and ecosystem responses to global change), 4) Management (rigorous assess how well restoration works, develop management strategies aligned with "Nature Futures" scenarios based on positive human-nature relationships, and develop watershed-based integrated management and restoration programs including dam building and operation), and 5 Social ecology (co-produce solutions to conflicts between conservation and people who use freshwater systems, develop adaptive management strategies that address trade-offs with a broad coalition of participants, and promote citizen science and participatory research). I was surprised that they left off legal research into how policy mechanisms for water management are working (or not), and am somewhat skeptical that agendas like this get used, but it's a nice overview of some needs and gaps.


REFERENCES:

Broadley, A., Stewart-Koster, B., Burford, M. A., & Brown, C. J. (2022). A global review of the critical link between river flows and productivity in marine fisheries. Reviews in Fish Biology and Fisheries, 0123456789. https://doi.org/10.1007/s11160-022-09711-0

Hamilton, H., Smyth, R. L., Young, B. E., Howard, T. G., Tracey, C., Breyer, S., Cameron, D. R., Chazal, A., Conley, A. K., Frye, C., & Schloss, C. (2022). Increasing taxonomic diversity and spatial resolution clarifies opportunities for protecting US imperiled species. Ecological Applications, 32(3), 1–19. https://doi.org/10.1002/eap.2534

Littlefield, C. E., & D’Amato, A. W. (2022). Identifying trade‐offs and opportunities for forest carbon and wildlife using a climate change adaptation lens. Conservation Science and Practice, 4(4), 1–14. https://doi.org/10.1111/csp2.12631

Maasri, A., Jähnig, S. C., Adamescu, M. C., Adrian, R., Baigun, C., Baird, D. J., Batista‐Morales, A., Bonada, N., Brown, L. E., Cai, Q., Campos‐Silva, J. V., Clausnitzer, V., Contreras‐MacBeath, T., Cooke, S. J., Datry, T., Delacámara, G., De Meester, L., Dijkstra, K. B., Do, V. T., … Worischka, S. (2022). A global agenda for advancing freshwater biodiversity research. Ecology Letters, 25(2), 255–263. https://doi.org/10.1111/ele.13931

Pennock, C. A., Budy, P., Macfarlane, W. W., Breen, M. J., Jimenez, J., & Schmidt, J. C. (2022). Native Fish Need A Natural Flow Regime. Fisheries, 47(3), 118–123. https://doi.org/10.1002/fsh.10703

Stephenson, N. L., Das, A. J., Condit, R., Russo, S. E., Baker, P. J., Beckman, N. G., Coomes, D. A., Lines, E. R., Morris, W. K., Rüger, N., Álvarez, E., Blundo, C., Bunyavejchewin, S., Chuyong, G., Davies, S. J., Duque, Á., Ewango, C. N., Flores, O., Franklin, J. F., … Zavala, M. A. (2014). Rate of tree carbon accumulation increases continuously with tree size. Nature, 507(7490), 90–93. https://doi.org/10.1038/nature12914


Sincerely,
 
Jon

Tuesday, March 1, 2022

March 2022 science summary

Winter biking


 Hello,


I've got a mix of papers this month but most relate to climate change (priorities for mitigation and adaptation, impacts on flooding, and how to plan for it) plus a couple of wildlife movement. 

If you know someone who wants to sign up to receive these summaries, they can do so at http://bit.ly/sciencejon (no need to email me).

CONSERVATION PRIORITIES / 30x30 / CLIMATE ADAPTATION:
Dreiss & Malcom 2022 is an analysis of priorities for protection under 30x30, considering hotspots of biodiversity and carbon, current protection (Fig 2), and threats. The two threats are risk of conversion (to non-habitat by 2050) and climate vulnerability (need for habitat / species to migrate elsewhere to survive, expressed in km/yr). They have two sets of hotspots, one with the top 10% of biodiversity (they calculated both imperiled species richness, and imperiled species range-size-rarity which captures how much habitat rare spp. have left), and one with the top 10% of carbon pools (not actual GHG mitigation potential, as it omits deep carbon like peat, other GHGs, and the albedo effect). Fig 3 has maps of their main results, but they're easier to see and explore in the interactive map at https://arcg.is/0SjGLK. Fig 4 highlights high conversion risk (>50%) and climate vulnerability for hotspots (top 10%) of biodiversity and carbon (4a = conversion & richness, 4b = conversion & carbon, 4c = climate vuln. & richness, 4d = climate vuln. & carbon). Upgrading all existing less strict protected areas (GAP 3) would achieve ~30% protection, but that would miss 80% of biodiversity hotspots (which are on private land). Similarly, 21% of unprotected biodiversity hotspots have at least a 50% chance of being converted by 2050. The authors didn't include political, social, or economic considerations, but there are still a lot of useful data in here.

Dreiss et al. 2022 identifies priority conservation locations within the contiguous US to support climate adaptation (via refugia and corridors). Fig 4c shows which climate refugia and corridors are unprotected (in gray) or underprotected (GAP 3 in orange). The bottom two rows in Table 3 shows that the best places for climate adaptation mostly don't overlap with the best places for biodiversity or carbon (~20-25% do). This means that focusing solely on biodiversity or carbon hotpsots is likely to miss critical refugia and corridors to help ensure resilience to climate change.


CLIMATE CHANGE IMPACTS:
Wing et al. 2022 modeled increasing US flooding risks due to both climate change (by 2050 under RCP4.5, which is 'medium' emissions but still means aggressive decarbonization) and changing populations. Note that the paper uses 'risk' in the engineering sense: likelihood of impact times magnitude of impact (so risk is reported as expected annual $ losses due to floods). Those losses are expected to go up 26% just from climate change (calculated at the building level based on current population data), but considering both climate change and population change they predict almost twice as many people will be impacted by flood each year (with that impact driven largely by population growth). The highest current flood risk is in predominantly white and extremely poor counties (partly b/c very poor people in areas at risk of floods have few financial assets not vulnerable to floods, so their relative risk is higher). The counties with the highest % Black population are expected to see twice as much risk increase by 2050 as counties with the fewest Black people. This is due a mix of increasing flooding risk in the Deep South, and the relatively low current risk of mostly Black counties. You can read more about this at https://www.washingtonpost.com/business/2022/01/31/climate-change-flooding-united-states/

Brown et al. 2022 has a good overview of recent improvements to incorporating climate change into conservation planning via the Conservation Standards (aka Open Standards for the Practice of Conservation). If you're not familiar with the Standards, this paper will be a bit overwhelming, but still has useful tidbits. Jump to figure 4 for a very helpful diagram of physical changes expected to result from climate change, and which of these changes make sense to classify as "direct climate threats" (in red text). What I love about this is it helps you move past (climate change will affect everything) and identify the specific changes that a) will affect focal species and ecosystems, and b) which you can affect via conservation. So rather than focusing on changes to rain, they identify decreased water availability and increased risk of landslides as climate threats. Then Fig 5b shows how the climate threats are integrated w/ other direct threats and linked to conservation targets (the species and ecosystems being prioritized for action). If you can handle switching examples, Figs 6 and 7 show how to move from a situation model (linking threats to targets and identifying possible strategies) to a results chain (showing the desired interim results and ultimate impacts of a strategy). There is some updated guidance available since this was published on the CMP web site.


WILDLIFE MOVEMENT / MIGRATION:
Merkle et al. 2022 addresses the problem that species which favor returning to fixed places to forage / breed / shelter have a hard time adjusting to habitat loss and resulting fragmentation. Figure 2 has a good example: mule deer in WY staying true to winter range despite oil & gas development, which the authors give as an example of an 'ecological trap' due to 'site fidelity' (they keep coming back even if they have better alternatives). They call for more research on what drives site fidelity (genetics, environmental conditions, or a mix), and for conservation plans to account for site fidelity rather than assuming animals will choose the best habitat possible.

Vynne et al. 2022 is a global analysis to find terrestrial ecoregions where only 1-3 large mammals (>33 lb, 298 species) are missing from the mammals that present 500 years ago (Fig 2 has a map of those results). Given the impact large mammals have on ecosystems, the idea is that getting back to the full suite of mammals that used to be there will have broader effects. But this is an assumption the authors make, rather than a conclusion of the analysis (most news headlines have implied the latter). The best known example of that is the impact of reintroducing wolves to Yellowstone leading to a trophic cascade (although unfortunately those effects have been widely exaggerated due to non-random aspen sampling and failing to account for confounding effects of human hunting and changes in streamflow due to climate). Their 30 priority ecoregions for reintroduction / restoration are in Table 2 and Figure S3. They note the challenges in reintroducing predators in particular, including the need to plan to avoid human conflict and difficulty of securing protection over large areas to allow for connectivity).


REFERENCES:

Brown, M. B., Morrison, J. C., Schulz, T. T., Cross, M. S., Püschel-Hoeneisen, N., Suresh, V., & Eguren, A. (2022). Using the Conservation Standards Framework to Address the Effects of Climate Change on Biodiversity and Ecosystem Services. Climate, 10(2), 13. https://doi.org/10.3390/cli10020013

Dreiss, L. M., & Malcom, J. W. (2022). Title identifying key federal, state, and private lands strategies for achieving 30 × 30 in the United States. Conservation Letters, May 2021, 1–12. https://doi.org/10.1111/conl.12849

Dreiss, L. M., Lacey, L. M., Weber, T. C., Delach, A., Niederman, T. E., & Malcom, J. W. (2022). Targeting current species ranges and carbon stocks fails to conserve biodiversity in a changing climate: opportunities to support climate adaptation under 30x30. Environmental Research Letters, 2(1), 0–31. https://doi.org/10.1088/1748-9326/ac4f8c

Merkle, J. A., Abrahms, B., Armstrong, J. B., Sawyer, H., Costa, D. P., & Chalfoun, A. D. (2022). Site fidelity as a maladaptive behavior in the Anthropocene. Frontiers in Ecology and the Environment, 1–8. https://doi.org/10.1002/fee.2456

Vynne, C., Gosling, J., Maney, C., Dinerstein, E., Lee, A. T. L., Burgess, N. D., Fernández, N., Fernando, S., Jhala, H., Jhala, Y., Noss, R. F., Proctor, M. F., Schipper, J., González‐Maya, J. F., Joshi, A. R., Olson, D., Ripple, W. J., & Svenning, J. (2022). An ecoregion‐based approach to restoring the world’s intact large mammal assemblages. Ecography, 1–12. https://doi.org/10.1111/ecog.06098

Wing, O. E. J., Lehman, W., Bates, P. D., Sampson, C. C., Quinn, N., Smith, A. M., Neal, J. C., Porter, J. R., & Kousky, C. (2022). Inequitable patterns of US flood risk in the Anthropocene. Nature Climate Change. https://doi.org/10.1038/s41558-021-01265-6

Sincerely,
 
Jon
 
p.s. If you'd like to keep track of what I write as well as what I read, I always link to both my informal blog posts and my formal publications (plus these summaries) at http://sciencejon.blogspot.com/
p.p.s. As shown in the pic above - I am a committed winter biker, and my wife and I very much enjoyed Arlington's winter bike games recently!

Tuesday, February 1, 2022

February 2022 science summary

Pineapple the 29" tall mini horse

Hi all,


January was a bit bananas so I've only got summaries of three papers on protected areas this month (efficacy of Indigenous protected areas, recommendations to improve North American connectivity, and the importance of inventoried roadless areas in US national forests).

If you know someone who wants to sign up to receive these summaries, they can do so at http://bit.ly/sciencejon

PROTECTED AREAS:
Sze et al. 2021 compares deforestation and degradation on protected Indigenous lands, unprotected Indigenous lands, protected non-Indigenous lands, and unprotected non-Indigenous lands. Their abstract slightly misrepresents their results, which found that Indigenous lands in the tropics typically provide modest protection against deforestation and degradation, roughly similar to formal protected areas (whether Indigenous or not). The results vary by geography; in Africa unprotected Indigenous lands do even better than protected areas by most measures, but in the Americas Indigenous lands (whether protected or not) fared worse than non-Indigenous protected areas, although still better than non-Indigenous unprotected areas. In some other cases Indigenous lands seem to offer little to no improvement over unprotected non-Indigenous lands. Just comparing non-Indigenous protected areas to Indigenous protected areas, in a slight majority of cases deforestation and degradation are higher in the IPAs (but with some exceptions being similar, and degradation in Asia-Pacific being lower in IPAs); this is surprising given the other findings and makes me think that their matching process (to control for confounding variables) didn't catch everything. Another way to look at their results is that in ~90% of cases they evaluated (the 36 dark lines in Fig 2, considering both geography and data source), both protected areas and Indigenous lands (whether protected or not) experience less deforestation and degradation than unprotected non-Indigenous areas). In the remaining ~10% of cases unprotected and non-Indigenous areas have either similar levels of deforestation and degradation to protected and/or Indigenous lands, or less deforestation and degradation. Overall, the main take-away on efficacy of Indigenous lands for protection is “promising but it depends.” Their results really depend on their matching process (since without it deforestation and degradation is actually lowest in non-protected and non-Indigenous areas in a slight majority of cases). It looks like the matching should correct for confounding factors like Indigenous areas tending to be located farther from development and on lower-value lands. Most of the differences they find are pretty small. So I end up concluding that in this paper Indigenous lands are very roughly on par with protected areas, but that it’s not definitive and depends on geography.

Barnett et al. 2021 model ecological connectivity across North America to make recommendations for protected areas that best retain connectivity. The interesting part of the paper is the comparison between circuit theory and least cost approaches and how they affect recommendations. Least cost assumes species have perfect knowledge about the landscape, which is obviously untrue but over generations if individuals explore a bit on their route those routes can improve as they learn. Having the map of priorities is not terribly useful, especially since this one is based on human modification data but w/ no calibration or validation using wildlife data. The paper I wish they had written was to actually compare both modeling approaches with empirical data on wildlife movement! Essentially asking what each model gets right and wrong, and make recommendations about which approach is more useful / accurate in what context, and whether a new paradigm is needed. In my own work I’ve learned to deeply discount the value of any model which isn’t first calibrated against real world data, and then validated against other real world data not used to build the model.

Dietz et al. 2021 look at inventoried roadless areas (IRAs) in national forests in the US lower 48 states, and how important they are to vertebrate wildlife species of conservation concern (SCC - defined broadly as any of: listed under Endangered Species Act, IUCN vulnerable or worse, or NatureServe vulnerable or worse either nationally or globally, 31% of all vertebrate wildlife species). They found 57% of SCC had at least some habitat on roadless areas, and 99% of the area in IRAs provided habitat for at least one SCC. Since they're looking at about 1/3 of wildlife species, it's not shocking that intact / undeveloped forests typically provide habitat to at least SOME of those species (although as they note, since IRAs don't exist for non-forest habitats it's still impressive). The policy implications are tricky - the authors argue IRAs are good candidates for strengthening protection, but on the other hand one could argue that focusing on intact areas with less protection than IRAs would offer more benefit.


REFERENCES:
Barnett, K., & Belote, R. T. (2021). Modeling an aspirational connected network of protected areas across North America. Ecological Applications, 31(6), 1–7. https://doi.org/10.1002/eap.2387

Dietz, M. S., Barnett, K., Belote, R. T., & Aplet, G. H. (2021). The importance of U.S. national forest roadless areas for vulnerable wildlife species. Global Ecology and Conservation, 32(November), e01943. https://doi.org/10.1016/j.gecco.2021.e01943

Sze, J. S., Carrasco, L. R., Childs, D., & Edwards, D. P. (2021). Reduced deforestation and degradation in Indigenous Lands pan-tropically. Nature Sustainability, 2. https://doi.org/10.1038/s41893-021-00815-2

Sincerely,
 
Jon

p.s. Pictured above is Pineapple the 29" tall mini horse. I took this photo at an event where kids in hospice (or with family members in hospice) got to hang out with horses

Wednesday, January 5, 2022

Best of 2021 science summaries

Jazzy snowman


Happy New Year!

I hope you got some time off of work and managed to stay healthy, whatever the end of the year was like for you.

As usual, I'm kicking the new year off by providing summaries for my favorite 15 articles of 2021, so that if you missed any of them you get another chance to check them out.

Also, this isn't a science article per se, but I helped to plan two webinars in 2021 with different experts providing their insights on how to best improve the impact of research (building on my 2020 paper on this topic), and I learned a ton from both. I hosted the first one (https://vimeo.com/506194985), and my colleague Peter Edwards hosted the next one (focused on Latin America, the Caribbean, and African contexts, https://vimeo.com/617423733). I've added links to the videos on this blog post where I've been collecting some related resources on the topic: http://impactblog.sciencejon.com/

If you know someone who wants to sign up to receive these summaries, they can do so at http://bit.ly/sciencejon. Here are the papers in alphabetical order (by author):

Barnes et al. 2018 highlights the downside of area targets: they may drive siting protected areas (PAs) in bad places and poor enforcement / management. They promote a shift to outcome-based protected area targets (meaning the targets are about biodiversity gains or avoided losses), emphasizing representation and connectivity, and building the evidence base for which factors affect how well PAs deliver conservation outcomes.

Dieckman et al. 2021 surveyed people about how important different social and cultural issues were to government decision makers vs. the general public. Respondents thought that government decision makers care the most about economic aspects, but that the public cares more about other social and cultural aspects. More tangible impacts (like water quality and physical safety) were perceived to be more important than intangible ones (like emotional health and local practices). Interestingly, biodiversity had the lowest perceived support second only to native culture.

Dobrowski et al. 2021 analyzes how much of the world will experience enough climate change to effectively shift into a different ecoregion, and how that relates to protected areas (PAs). They move ecoregions' location to keep their historic climate similar, which is an interesting thought exercise but not a likely scenario (given variations in soil and topography and other factors that will not shift w/ climate). They found that with 2C warming, 54% of land will effectively change ecoregions, with 22% shifting biomes (see Fig 4 for how this affects % protected by biome). This means there are winners and losers, with the biggest losers the ~5% of land within PAs that don't have an analogous climate w/in 2000 km for species to migrate to (shown in black in Figs 2b & 3b; 56 ecoregions 'disappear'). They recommend a focus on unmodified areas expected to be climatically stable that are currently underprotected, as well as areas that improve climate connectivity (see Fig 6 for a case study in the NW US and Canada). They also have a tool where you choose a place, and it'll tell you what other place currently has the climate the first place is expected to have w 2C (or 4C) warming: https://plus2c.org/

Ellis et al. 2021 argue that protecting untouched or unmodified habitat from people is a fundamentally flawed framing, b/c most habitat on earth has been to some degree inhabited by (and modified by) people for thousands of years). It's a good point that what we consider 'natural' is subjective and arbitrary (e.g. the grasslands of the Midwestern U.S. are a result of thousands of years of intentionally set fires and other impacts by Indigenous people), and modified ecosystems may have higher species richness or other metrics. They have great data on how much habitats and land use have changed over time (check out all the figures for that), and make an excellent case about how wrong it is to depict human use of nature as a recent despoiling of human-free places. They further argue that current biodiversity losses come from "the appropriation, colonization, and intensifying use of the biodiverse cultural landscapes long shaped and sustained by prior societies" and that the solution lies in empowering the stewardship of Indigenous people and local communities. I agree that opinions about which kind of ecosystem and land use is "good" are subjective, that there are good social and human rights reasons to support local autonomy, and that typically local and Indigenous people use natural areas in a way more compatible with biodiversity than how people from elsewhere tend to. I think it's also worth recognizing that even Indigenous people have consistently caused some extinctions (of large mammals in particular) when they first arrived to actually uninhabited ecosystems, and that in some cases they currently support the same kind of intensification associated with colonialism. So local autonomy will not always be a recipe for maintaining ecosystems more or less as they currently are, although there are plenty of valid opinions about which human and ecosystem outcomes conservation organizations should work to support. I'd definitely recommend reading the paper, and I realize I have a lot of listening and learning to do on the subject of Indigenous-led conservation.

Evans et al. 2021 estimated how to reduce greenhouse gases (GHGs) by raising water levels in peatlands which have been drained for agriculture. They found raising the water table by 10cm (re-wetting the peat) reduces net greenhouse gases (GHGs) by an average of 3 t CO2e/yr until it rises to a depth 30cm, from 30cm-8cm rising methane results in smaller net GHG benefits, and <8cm GHGs become net positive (see Fig 1). Cutting the water table depth in half globally (raising it to an average of 45cm in croplands and 25cm in grasslands) would cut emissions from drained peat by about 2/3 (from 786 Mt [aka MMT] CO2e/yr to 278 MT CO2e/yr). These are conservative estimates (leaving out N2O and reduced emissions from avoided deep fires), although the range of those estimates is huge (see Table 1). Alternatively re-wetting all peat up to 10cm would eliminate almost all peat emissions and likely even drive them slightly negative (15 Mt CO2e/yr). However, cutting water table depth in half would flood part of the root zone for most crops and regions, which would reduce yield. But raising the water table to just below the root zone could have big GHG benefits and potentially even improve crop resilience to drought. This is a big opportunity!

Grantham et al. 2020 estimates how much forests have been fragmented and modified around the world. They look at proximity to infrastructure, agriculture, and tree cover loss, along with lost forest connectivity, to estimate forest modification. The way they defined modification means that only forests in the most remote and sparsely populated areas are scored as having high landscape integrity (see figure 2 and figure 4), although this was still ~40% of global forest area. They find 56% of protected forests have high landscape-level integrity (table 2). I agree with the authors that forest modification and degradation is important, but I don't think the authors made a good case that a) their findings are new / surprising, or that b) just mapping proximity to people is a great way to estimate ecological degradation let alone prioritize conservation action. It's true that being farther from people is generally helpful to forests, but the flip side is that this paper heavily devalues the natural areas that people most appreciate for recreation and ecosystem services, even though with high ecological function. It also ignores the contribution people can make to good stewardship and management.

Guadagno et al. 2021 is an an excellent new report from the Wildlife Conservation Society (as part of the Failure Factors Initiative) looking at the experience of conservation NGOs with using “pause and reflect” sessions to learn from failure (and success). Here are my key take-aways:

  • People are reticent to talk publicly about failure for fear of losing respect, status and support for their work.
  • Documenting “lessons learned” in reports is not as important as staff going through the process of talking together and informally learning from each other.
  • Regularly reflecting on both what is working well and what could be improved (even for minor things, and for both successes and failures) makes teams better equipped to respond to serious or major failures (see Example 4 on p14). Having already built both trust and familiarity with a healthy way to learn from failure is excellent preparation when crises arise, allowing the group to work together to pivot effectively. These sessions don't have to take much time.
  • Those regular reflections work best when there is high psychological safety (be respectful, focus on what happened and what to do next time and not who is to blame, recognize and address bias) and they are structured around a few core questions (what did we expect to happen vs. what happened, what went well and why, what can be improved and how). See page 21-25 for recommendations on how to do this, as well as guides / questions you can use.
  • Sometimes a failure looks like a success at first, and in these reflections you can look for other explanations for apparent success (as per Example 1 on p7) allowing you to identify hidden problems and resolve them.
  • Other times, a failure is at least partially a success, and these sessions can also identify some aspects of work going well even when we don’t achieve the outcomes we hoped for (see Example 2 on p11). Also even successes can probably be improved! (see Example 3 on p13).


The 2021 IPCC report had a lot of useful information! https://www.ipcc.ch/report/ar6/wg1/ Don't feel like reading 1,800 pages or even the 90 page summary or 215 page FAQ? Check out the 2 page 'headline statements' here:  https://www.ipcc.ch/report/ar6/wg1/downloads/report/IPCC_AR6_WGI_Headline_Statements.pdf
The one thing to highlight for me is that limiting warming to 1.5C is now harder but not impossible (requiring net zero by 2055 w/ 90% gross emissions reductions). Current policies agreed to under Paris would still lead to 3C warming by 2100. One finding that I read about in this New York Times article (https://www.nytimes.com/2021/08/09/climate/climate-change-report-ipcc-un.html) really struck me: a bad heat wave that used to happen every ~50 years is now happening every ~10 years, and will happen every ~5 years at 1.5C or nearly annually at 4C. Don't miss this interactive tool to explore the results (and note you can download spatial data via the "share" icon): https://interactive-atlas.ipcc.ch/

Jenkins et al. 2015 highlights an inconvenient truth about protected areas in the United States: they are mostly located in places with relatively low species richness and threats of conversion. In other words, if the main goal of protected areas is to prevent as many species as possible from going extinct, they're poorly sited. You can compare biodiversity maps in Fig 1 & 2 to PAs in Fig 3 to see the mismatch. Fig 4 has their recommendations for 9 areas where conservation should be focused in the SE and West coast.

The findings of Leal et al. 2020 may seem obvious, but they're important to highlight: conservation planning focused on terrestrial species only does a poor job at protecting freshwater biodiversity. They did some modeling in Brazil to look at trade-offs between freshwater and terrestrial species, and how to improve planning. Their low-bar recommendation is that even without data on freshwater biodiversity, just considering aquatic connectivity in additional to terrestrial species roughly doubles the benefit to freshwater species with almost no decrease in terrestrial benefits (Fig 3e & 3f, purple lines). If planning considers both terrestrial and freshwater biodiversity data, about a 5% decrease in terrestrial benefits leads to a ~400% increase in freshwater benefits (Fig 3e & 3f, aqua lines). This represents a strong case against assuming terrestrial work will do a good job at protecting freshwater ecosystems, and the idea of just including aquatic connectivity is an appealing entry point in places where better freshwater data are unavailable.

LeFlore et al. 2021 looks at factors that tend to result in research being used via a focus on 40 small-scale conservation research projects on the Salish Sea. They found having a government collaborator was key, as was stakeholder engagement throughout the process, and that publishing a journal article didn't increase the chances of the research being used to inform decision-making. The impact bit was self-reported so I was pretty surprised only 40% of the projects were reported as leading to impact! It's hard to know how generalizable their results are, but I think it's fair to ask researchers to compare the time it takes to substantially engage w/ decision makers and other stakeholders, compare that to the time needed to publish, and to reflect on which is a higher priority use of their time. Full disclosure: I was a peer-reviewer of this paper.

Pressey et al. 2021 is an opinion piece arguing that conservationists need to shift focus from area-based protection targets (even those including representation) to avoided biodiversity loss (species extinction and habitat destruction) and ecological recovery. They make a fair and important point: despite increasing protection, the overall global trend of species and habitat loss is accelerating. So protected areas aren't working effectively (whether they're not managed well, or in the wrong places, or there aren't enough of them, or a mix). That's hard to argue with, and it's key that we find a way to better mitigate acute threats. But they lose me when they call for a lot more modeling of counterfactuals and monitoring of outcomes relative to the modeling. I've done that modeling, and it's slow, expensive, and subject to lots of assumptions and uncertainty. So rather than shifting lots of implementation dollars to more science, I'd favor using 'just enough' science to identify key needs for conservation, push advocacy to focus more on those needs than is currently happening, and do more spot monitoring to check efficacy and adapt.

Waldron et al. 2020 looks at global financial implications of 30 x 30 (6 terrestrial and 5 marine scenarios), and for tropical forests & mangroves adds in avoided costs and non-monetary ecosystem service values. They estimate that expanding protected areas (PAs) to 30% could result in increased direct global revenues of $64-454 billion / yr (depending on the scenario chosen, and mostly driven by increased nature tourism, see Table 3) as well as more food and wood production. Broader economic benefits (largely from avoided storm damage) could be $170-534 billion / yr more. With a estimated cost of $103-$178 billion / yr (which includes funding to manage existing PAs), they find net economic benefits to 30x30 across all scenarios (spend some time with Table 3 to see the details, but $235 billion / yr is the lowest net financial benefit). It's hard to vet this kind of complex analysis with a ton of assumptions. My gut tells me this is a pretty optimistic assessment due to several key assumptions (like a social cost of carbon at $135-540 / t CO2e , assuming big tourism increases and scarcity of wood driving up forest product revenue, etc.). But they point out that it could be an underestimate since they didn't include broader benefits of other ecosystems like grasslands. Note that other scientists criticized the Waldron paper, noting that not nearly enough has been done to estimate how 30x30 would affect people (nor to consult with them), among other issues. The critique (Agrawal et al. 2020) is here: https://openlettertowaldronetal.wordpress.com/

Welsby et al. 2021 ask an interesting question: what fraction of economically viable fossil fuels need to left in the ground to give us a 50% shot at limiting warming to 1.5C? The answer is pretty stark: by 2050 we need to leave 58% of oil, 59% of methane gas, and 89% of coal underground (a 3% annual reduction in oil and gas). See table 1 for their estimates by region. They note that we may need to leave even more fuels unextracted given questions about how fast we can develop "negative emissions" technology (carbon capture and storage).

As a number of NGOs look to invest in reforestation and forest protection as part of the solution to climate change, Williams et al. 2021 has a very important caveat. They found that while forests cool the earth by sequestering and storing carbon, they can also warm the earth in some cases by absorbing more heat than bare ground or snow would. So some forest loss in the U.S. (lower 48 where they did their modeling) has led to net cooling, even though overall it has led to warming. The cooling mostly happened in the Western US where there’s a lot of snow cover and the arid conditions make for light-color, reflective soils (so losing trees results in less local heat absorption). This paper is more pessimistic than the others I’ve read about temperate forests (for example Li et al. 2015 used remote sensing to actually measure temperature changes and compare nearby pixels with forest vs. open land cover) and finds that 15 years of forest loss only caused warming equal to 17% of a U.S. annual fossil fuel emissions (because the most forest loss has happened in Western states with lots of snow cover, balancing out more moderate forest loss elsewhere). Other work on this topic has found that boreal forests are the most likely to cause net warming (as per Mykleby et al. 2017), but for tropical forest accounting for evapotranspiration and albedo actually enhances their net cooling effect.


REFERENCES:
Barnes, M. D., Glew, L., Wyborn, C., & Craigie, I. D. (2018). Prevent perverse outcomes from global protected area policy. Nature Ecology & Evolution, 2(5), 759–762. https://doi.org/10.1038/s41559-018-0501-y

Dieckmann, N. F., Gregory, R., Satterfield, T., Mayorga, M., & Slovic, P. (2021). Characterizing public perceptions of social and cultural impacts in policy decisions. Proceedings of the National Academy of Sciences, 118(24), e2020491118. https://doi.org/10.1073/pnas.2020491118

Dobrowski, S. Z., Littlefield, C. E., Lyons, D. S., Hollenberg, C., Carroll, C., Parks, S. A., Abatzoglou, J. T., Hegewisch, K., & Gage, J. (2021). Protected-area targets could be undermined by climate change-driven shifts in ecoregions and biomes. Communications Earth & Environment, 2(1), 198. https://doi.org/10.1038/s43247-021-00270-z

Ellis, E. C., Gauthier, N., Klein Goldewijk, K., Bliege Bird, R., Boivin, N., Díaz, S., Fuller, D. Q., Gill, J. L., Kaplan, J. O., Kingston, N., Locke, H., McMichael, C. N. H., Ranco, D., Rick, T. C., Shaw, M. R., Stephens, L., Svenning, J.-C., & Watson, J. E. M. (2021). People have shaped most of terrestrial nature for at least 12,000 years. Proceedings of the National Academy of Sciences, 118(17), e2023483118. https://doi.org/10.1073/pnas.2023483118

Evans, C. D., Peacock, M., Baird, A. J., Artz, R. R. E., Burden, A., Callaghan, N., Chapman, P. J., Cooper, H. M., Coyle, M., Craig, E., Cumming, A., Dixon, S., Gauci, V., Grayson, R. P., Helfter, C., Heppell, C. M., Holden, J., Jones, D. L., Kaduk, J., … Morrison, R. (2021). Overriding water table control on managed peatland greenhouse gas emissions. Nature. https://doi.org/10.1038/s41586-021-03523-1

Grantham, H. S., Duncan, A., Evans, T. D., Jones, K. R., Beyer, H. L., Schuster, R., Walston, J., Ray, J. C., Robinson, J. G., Callow, M., Clements, T., Costa, H. M., DeGemmis, A., Elsen, P. R., Ervin, J., Franco, P., Goldman, E., Goetz, S., Hansen, A., … Watson, J. E. M. (2020). Anthropogenic modification of forests means only 40% of remaining forests have high ecosystem integrity. Nature Communications, 11(1), 1–10. https://doi.org/10.1038/s41467-020-19493-3

IPCC, 2021: Climate Change 2021: The Physical Science Basis. Contribution of Working Group I to the Sixth Assessment Report of the Intergovernmental Panel on Climate Change [Masson-Delmotte, V., P. Zhai, A. Pirani, S. L. Connors, C. Péan, S. Berger, N. Caud, Y. Chen, L. Goldfarb, M. I. Gomis, M. Huang, K. Leitzell, E. Lonnoy, J. B. R. Matthews, T. K. Maycock, T. Waterfield, O. Yelekçi, R. Yu and B. Zhou (eds.)]. Cambridge University Press. In Press. https://www.ipcc.ch/report/ar6/wg1/

Jenkins, C. N., Van Houtan, K. S., Pimm, S. L., & Sexton, J. O. (2015). “US protected lands mismatch biodiversity priorities.” Proceedings of the National Academy of Sciences, 112(16), 5081–5086. https://doi.org/10.1073/pnas.1418034112

Leal, C. G., Lennox, G. D., Ferraz, S. F. B., Ferreira, J., Gardner, T. A., Thomson, J. R., Berenguer, E., Lees, A. C., Hughes, R. M., Mac Nally, R., Aragão, L. E. O. C., de Brito, J. G., Castello, L., Garrett, R. D., Hamada, N., Juen, L., Leitão, R. P., Louzada, J., Morello, T. F., … Barlow, J. (2020). Integrated terrestrial-freshwater planning doubles conservation of tropical aquatic species. Science, 370(6512), 117–121. https://doi.org/10.1126/science.aba7580

Guadagno, L., Vecchiarelli, B. M., Kretser, H., & Wilkie, D. (2021). Reflection and Learning from Failure in Conservation Organizations: A Report for the Failure Factors Initiative. https://doi.org/10.19121/2021.Report.40769

LeFlore, M., Bunn, D., Sebastian, P., & Gaydos, J. K. (2021). Improving the probability that small‐scale science will benefit conservation. Conservation Science and Practice, October. https://doi.org/10.1111/csp2.571

Pressey, R. L., Visconti, P., McKinnon, M. C., Gurney, G. G., Barnes, M. D., Glew, L., & Maron, M. (2021). The mismeasure of conservation. Trends in Ecology & Evolution, 36(9), 808–821. https://doi.org/10.1016/j.tree.2021.06.008

Waldron, A., Adams, V., Allan, J., Arnell, A., Asner, G., Atkinson, S., Baccini, A., Baillie, J. E., Balmford, A., Austin Beau, J., Brander, L., Brondizio, E., Bruner, A., Burgess, N., Burkart, K., Butchart, S., Button, R., Carrasco, R., Cheung, W., … Zhang, Y. (2020). Protecting 30% of the planet for nature: costs, benefits and economic implications.

Welsby, D., Price, J., Pye, S., & Ekins, P. (2021). Unextractable fossil fuels in a 1.5 °C world. Nature, 597(7875), 230–234. https://doi.org/10.1038/s41586-021-03821-8

Williams, C. A., Gu, H., & Jiao, T. (2021). Climate impacts of U.S. forest loss span net warming to net cooling. Science Advances, 7(7), 1–7. https://doi.org/10.1126/sciadv.aax8859


Sincerely,
 
Jon