Thursday, February 28, 2013

Evolution of nerve cells: progress towards an unsolved mystery

image from https://en.wikipedia.org/wiki/Axon_terminal#/media/File:Synapse_diag1.svg


I had always taken evolution more or less for granted. The evidence in support of it is pretty overwhelming, and the remaining gaps in the theory are pretty small. But when I took a biophysics class about 15 years ago and learned about the incredible complexity of the nervous system, I was taken aback. It’s easy to think about the evolution of something like a wing, where intermediate steps might lead to the ability to make longer jumps or glide before flight is eventually possible. But our neurons require several ion channels to send electrical impulses, and some of the steps towards even a primitive nervous system offer no apparent benefit, making it difficult to understand how they could have evolved. Eventually I had to accept that this was a mystery that we couldn’t answer yet.

While it’s not yet entirely clear what the value of some of the early steps towards a functioning nervous system was, there has been some recent research that shows how it evolved. Voltage-gated sodium channels (a key component of what allows a neuron to generate an electrical impulse) have recently been found to exist in early organisms before neurons existed (http://www.pnas.org/content/109/suppl.1/10619.abstract). There has also been work showing how some of the proteins used in neurons also were developed before neurons (http://www.plosone.org/article/fetchArticle.action?articleURI=info:doi/10.1371/journal.pone.0000506).

It can be tempting to avoid thinking about gaps in dominant scientific theories (whether unexplained steps in evolution, the inability of the standard model in particle physics to explain gravity, remaining areas of uncertainty in climate change modeling, etc.). But I love keeping an eye open for new research into topics that I remain unsatisfied by. I’m encouraged that while we’re still not entirely clear why these early components of neurons spread, we at least have evidence showing how the neuron evolved.

Monday, February 11, 2013

Learning to love creepy bugs


My latest blog post (Everyday Nature: How I Came to Love House Centipedes) is up at


The basic idea is that even though bugs like house centipedes and nematodes can be super gross, once you know what they do (e.g. eat roaches and bedbugs, and eat fly larvae respectively) they start to look a whole lot better!

Wednesday, January 30, 2013

Citizen Science: Reveling in Urban Ecology


The Nature Conservancy recently switched its blogs around a bit. "Cool Green Science" will now feature posts from TNC scientists on the latest research, commentary on important conservation issues, natural history notes, and ways you can participate in citizen science.

My first post on the new blog (Citizen Science: Reveling in Urban Ecology) fits into the latter two categories. I outline one of my favorite assignments from college, where I observed urban wildlife twice a week for a semester. I guarantee that if you try this, you will be surprised at how much you learn, how much variation you will see, and how fun it is.

If you are interested in moving beyond having some fun looking at urban wildlife and into actually participating in citizen science, here are a couple of resources to get started:
http://urbanecologycenter.org/
http://nestwatch.org/

Sunday, December 9, 2012

Vegan Vs. non-vegan perceptions of vegan cheeses

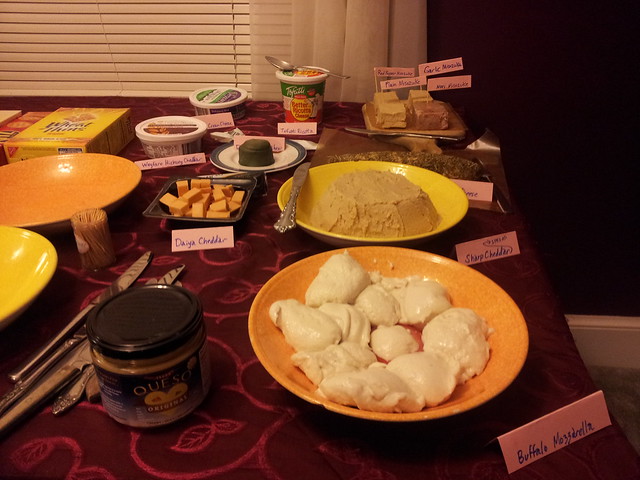
Wine & Vegan Cheese Party

OK, I promise this is the last "kitchen science" post for a while (and yes, I realize that this post is pretty weak science). There was just too much interesting data for me to resist giving it some proper space and discussion. The basic idea is that we had a wine and vegan cheese party (click the link for more details), and I thought it would be fun to collect some data.

I often hear vegans saying how various vegan cheeses are "just like the real thing," while non-vegans never seem to have the same perception. However, despite not thinking they are much like cheese, they still sometimes enjoy them on their own merit. My hypothesis was that vegans would have slightly higher flavor ratings, but much higher "cheesiness" ratings. I also thought that good flavor would only be weakly correlated with cheesiness (since something that isn't much like cheese could still be delicious).

Before I dive into the data, a quick side note. Modern cheese is generally made with pure cultures of starter bacteria: usually species from the Lactococcus and Lactobacillus (with many others used for certain kinds of cheeses). Since we didn't have access to these cultures, we simply used "rejuvelac," which is basically fermented sprouted grain (which tastes like a mix of foot stink and cheese soda). This mostly includes slightly different species of Lactobacillus (e.g. L. acidophilus) and some other bacterial genera. A really interesting experiment would be to make some of these recipes with pure cheese cultures and compare to the results you get with rejuvelac. Anyway, on to the data!

I created simple data sheets that asked each responded whether they were vegan or not (7 vegans and 6 non-vegans responded), whether they would eat any of the cheeses again (all 13 respondents said yes), and to rate each of twelve vegan cheeses on a scale from 1 (ugh) to 5 (meh) to 9 (wow!) for both taste and cheesiness. Note that if this was real science, tasting should have been done by individuals in isolation under controlled circumstances, rather than at a party. Perceptions will change based on what others think, the crackers used, the order eaten, portion size, and many other variables. But controlled experiments make for lousy parties, so we kept it informal.

We had 15 cheeses, but I only planned for 12 of them (guests brought the other 3) so only 12 were on the data sheet. As a result, there were not enough ratings of the other three to be analyzed, but I included the ratings on the full spreadsheet of results.

Overall, vegan and nonvegan ratings were much closer than expected. Across all cheeses, vegans assigned a mean flavor of 6.1 vs 6.0 for non-vegans. Vegans gave an average 5.2 on cheesiness vs. 4.9 for non-vegans (a bigger difference than for flavor, but still surprisingly close). However, I did note that the commercial cheeses were rated lower by non-vegans than vegans, as shown in the graphs below. Homemade cheeses were both rated higher, and were easier for vegans and non-vegans to agree on.

I was guessing that flavor wouldn't have much correlation to cheesiness, but they were better matched than I expected. It's hard to see much from the raw data (each person's rating of each cheese plotted individually):
It is clear that there's a lot of variation, but that there is a general weak positive trend. This is a lot easier to see if you aggregate the ratings of flavor and cheesiness by cheese (so that there are only 12 data points):
The R2 value is still not terribly high, but the fact that this is a linear relationship is a lot more clear here. While that suffices for testing the two hypotheses, naturally I was also curious about which cheeses were the most popular, and how much variation there was. The following two graphs show the mean flavor and cheesiness ratings (for all recipients), with error bars showing standard deviation. Note that a single respondent (my wife Sarah) doubled the standard deviation for the goat cheese (she was atypical in her strong dislike of it).


Then I realized that I also wanted to be able to show the full range responses, so I redid those two charts with the minimum and maximum ratings instead of standard deviation. Note that the two graphs above were redone to be more clear as an example for a workshop on good (and bad) chart design, but the following two were not.

In particular I think it's interesting that only the Mozzarella and Goat Cheese received maximum scores for cheesiness (each got a nine from a vegan and another one from a non-vegan), and that there was a wider range of opinions on cheesiness than there was for flavor.

Still hungry for more breakdowns of the data? The full spreadsheet contains the raw data, the charts, and several other summaries not provided here. At some point, you just have to say "enough."

Sunday, October 21, 2012

Does microwave power influence heating time and efficiency?

Microwave Effiency Test
We have two microwaves in the kitchen at work, and while waiting for our food to heat up, there is always debate over how much faster one of them is. I also found myself wondering whether the faster one used more or less energy to produce the same amount of heat.

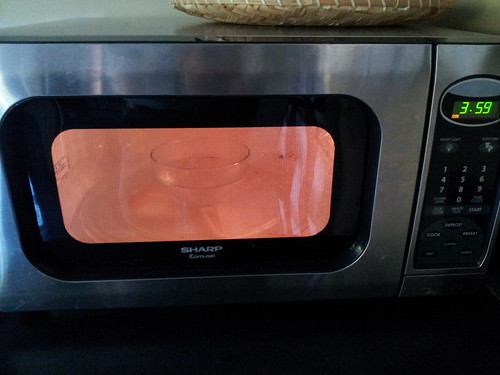
In order to test this, I used a Kill-a-watt meter to measure energy use, and timed how long it took in various microwaves to heat 12 oz of water from 66.5 F to boiling (measured by the appearance of bubbles on the top surface of the water), which should have taken 0.033 kWh. I was guessing that the microwaves listed as using more power would both heat it up faster, and use more energy.

The results are below. I was surprised how inefficient the microwaves were, even if they had performed to the specifications in the manual (and they did not). Theoretical efficiency varied from 64% to 70%, but actual efficiency varied from 42% to 67%.

Essentially, higher power microwaves tend to heat up water faster,but it's not a strong linear relationship. There's almost no relationship between energy use and heating time. Also, while in general higher power microwaves use more energy to perform the same task, that wasn't as clear as expected either. For the two microwaves on the 4th floor at work (the ones I use), the faster one of the two was only 10% faster but used roughly the same amount of energy. However, I should note that since the energy meter only reported use to the nearest 0.01 kWh, the precision for energy use is pretty low. I came up with a combined metric (seconds to heat the water times energy use) to give them points both for efficiency and speed, and there was quite a bit of variety there as well.


Elapsed seconds Total Energy Used, kWh Actual Efficiency Labeled Efficiency Labeled Power Use, W Labeled Power Output, W Time * Total Energy
209 0.05 66.7% 65.0% 1000 650 10.450
197 0.05 66.7% 70.0% 1000 700 9.850
195 0.07 47.6% n/a 1300 n/a 13.650
232 0.07 47.6% 64.0% 1250 800 16.240
172 0.08 41.7% 68.8% 1600 1100 13.760
217 0.07 47.6% 66.7% 1350 900 15.190
168 0.07 47.6% 64.1% 1560 1000 11.76
243 0.08 41.7% 66.7% 1350 900 19.44


Wednesday, October 17, 2012

Does real sugar make Mexican Coke taste better?

UPDATE: Newer results are now at the bottom of this article.

If you live in a big city, chances are that you've heard the hype about Mexican Coke, and seen it for sale in hip indie bakeries, food trucks, and coffee shops. In case you haven't, since Mexican Coke is made from "real sugar" some people go nuts for it, and extoll its virtues to anyone who will listen. However,  I was somewhat suspicious the difference was so clear, since high fructose corn syrup is about 55% fructose and 42% glucose (very similar to the 50 / 50 split of table sugar aka sucrose), and the ingredients are otherwise identical. Other than the different type of sugar, the only other difference is that Mexican Coke has 85 mg sodium instead of 45 mg for American Coke.

I decided a good old double-blind taste test would be a good way to find out. If you're not familiar with "double-blind" studies, they ensure that the person running the experiment can't unconsciously bias the results. Why does that matter? The expectations of observers can lead to people believing that horses can do math. As I was planning the test, I found one double-blind test that found some people can tell the difference (but prefer American Coke), one test that claimed to be blind (although the tasting comments make it clear it was not) which found Mexican Coke clearly superior, and plenty of non-blind taste tests where people confirm their belief that Mexican Coke is way better.

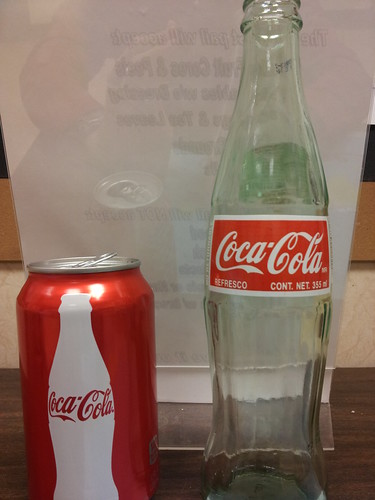
I had several people tell me that there was a really noticeable difference in taste between the two kinds of Coke. Some people described American Coke as tasting "fake" or "chemically" or even having "an arsey aftertaste," while Mexican Coke tastes "more natural," or has "a much more complex flavor." To find out if that was true I wanted the test to have four samples: two Mexican Coke and two American Coke (see the note at the bottom as to why four samples instead of three). If the taste difference was clear, tasters should be able to correctly match the two pairs of identical samples. Ideally I would have used American coke in a glass bottle, but I couldn't find it so I ended up using one sample of canned American coke, and one sample of American coke in a plastic bottle. All Cokes were as fresh as possible, and kept at the same temperature in a mini fridge for several hours before the experiment.

For the experiment, I set up four identical cups for each taster, arranged in rows. I labeled each row with a letter (a through d), and poured in 1 oz of each Coke into the sample cups so that each taster had the same set of four samples. I then asked a colleague (who didn't know which kind of coke corresponded to which letter) to replace the letters with numbers with me out of the room (so I wouldn't know which kind of coke corresponded to each number either). We then brought in 7 more tasters (nine total), and gave each one a data sheet to indicate which samples they thought were identical, which one(s) were their favorite, and if they were a regular drinker of Coke (EDIT: I ran two follow-up tests later, see below for details).

The basic finding was that while many of the tasters thought we tasted a difference, none of us correctly identified that the first two samples were the same (Mexican Coke), and the second two samples were the same (American Coke). Only one taster correctly identified either pair (she correctly identified that the American Coke samples were the same, but thought that the two Mexican Coke samples were different). Thus, I conclude that Mexican Coke and American Coke do not have a strong enough difference in flavor to be readily detectable.

That doesn't mean that Mexican Coke isn't perceived as better with your eyes open; it may be all in your head, but if you enjoy Mexican Coke more that is real to you. After all, even when they know that they're taking a placebo, patients may still show improved health relative to patients with no treatment.

Here is the raw data for those interested (updated to include the 2nd and 3rd tests). Samples 1 and 2 both turned out to be Mexican Coke, Sample 3 was the American Coke in a plastic bottle, Sample 4 was the American Coke in a can.

Although we had a small sample size, with nine people including three regular Coke drinkers, if there was a clear taste difference someone should have been able to distinguish it. In fact, purely by guessing randomly there was a 75% chance that one or more person would correctly pair the samples, and a 49% chance that someone would correctly identify all samples. See the EDIT note below for the results of a second and third taste test!

I generally have a pretty good palate, but since I never drink soft drinks, I was pretty overwhelmed by how sweet and tart the Coke was. As such, asking me to distinguish between Cokes may be like asking a classical music critic to compare Pantera to Napalm Death (i.e. there may well be a difference, with the fault lying in the lack of context /training of the observer).

For a future test, it would be ideal to change the order of the tasting, as other research has found that the first sip is often perceived differently from further sips. I went back and forth several times between the samples, and the more I tasted the more they tasted identical to me (earlier I mistakenly grouped the four samples into mismatched pairs). I'd also like to do a taste test with plain sugar and plain HFCS dissolved in pure water, to see if people can tell the difference with all other factors absolutely identical.

Have you done your own taste test? If so, let me know about it in the comments!

EDIT: Since the industry standard for taste tests is a "triangle" test where two samples are identical and one is not, some people have asked why I went with four. There are two reasons. First, since I couldn't get American coke in glass bottles, I wanted to see if a plastic bottle vs a can made a difference. With only three samples, in theory every sample could have been slightly different, whereas with four I could be confident that if there was a noticeable difference, at least two of the samples should have been consistently paired (the two Mexican coke ones).

The second reason is to increase the confidence of the findings. With a triangle test, a taster has a 33% chance of randomly picking which of the three samples is different ("sample #2 is different"), and a 17% chance of correctly identifying all samples by chance (e.g. "#1 is American Coke, #2 is Mexican Coke, and #3 is American Coke"). While having two samples of each kind of Coke does not affect these probabilities, by telling tasters that the experimental setup is either two pairs of each sample, or one sample of one and three samples of the other, their chance of correctly guessing goes down significantly (assuming that they don't know that I am actually providing two of each sample). This gives them a 14% chance of correctly identifying which samples are the same (e.g." #1 & #2 are the same, and #3 and #4 are the same, but I don't know which is American and which is Mexican") and a 7% chance of correctly identifying all samples.

I recently had a chance to repeat this test with four more tasters (this time I used American Coke in a plastic bottle and Mexican Coke in glass, but again used two samples of each). One of the tasters correctly paired the samples (although she thought the American Coke was Mexican and vice versa), however with 13 total tasters there is an 87% chance someone would have paired the samples correctly by chance. If you consider the second test as an independent event of four tasters, there is still a 46% chance that at least one taster would correctly distinguish all samples.

In order to be test if she could actually taste the difference, I set up another test. This time I went with 5 samples to increase my confidence in the results even further. I wanted to use two samples of one, and three of the other; if I used one and four and it happened that the first sample was the different one it could yield a false positive (since there is a bias for the first sample to taste different). With two and three, even if the taster correctly assumes that is the setup (I didn't tell her how many there were of each), there is still only a 10% chance of distinguishing all samples by chance, and a 5% chance of identifying them all by chance. Her chance of correctly distinguishing the samples on both tests was only 1.4% (so if she was able to do so, we could be confident that she could really taste a difference). Of the 5 samples, she correctly identified only the last two, and incorrectly paired those samples with samples containing the other Coke product.

So in conclusion, less people correctly distinguished the samples than we would have expected by chance alone, and the one person who distinguished them once was unable to do so a second time. It is interesting to note that after the third test, several of us tested the two samples knowing what they were, and each of us thought that there was a clear difference in taste (despite our inability to tell that with our eyes closed). A final interesting test would be to give all tasters a sample of each correctly labeled to "calibrate" their palate. Then the double blind test could be administered to see if they do any better.

2nd EDIT: We finally had a test where the difference was detectable! However, the Mexican coke in this batch was noticeably flatter (less carbonated) which almost certainly had an impact. Even swirling the cups to get most small bubbles out, all 3 tasters tasted a difference. One got the first two samples right, but then said "once I had the American coke aftertaste in my mouth it all tasted the same." I noticed that the Mexican coke was noticeably saltier, which on the one had makes sense as the sodium content is almost double (85 mg vs 40 mg), but on the other hand that's a difference of 1/64 tsp of salt in a whole can, which is a truly miniscule amount per sample cup.